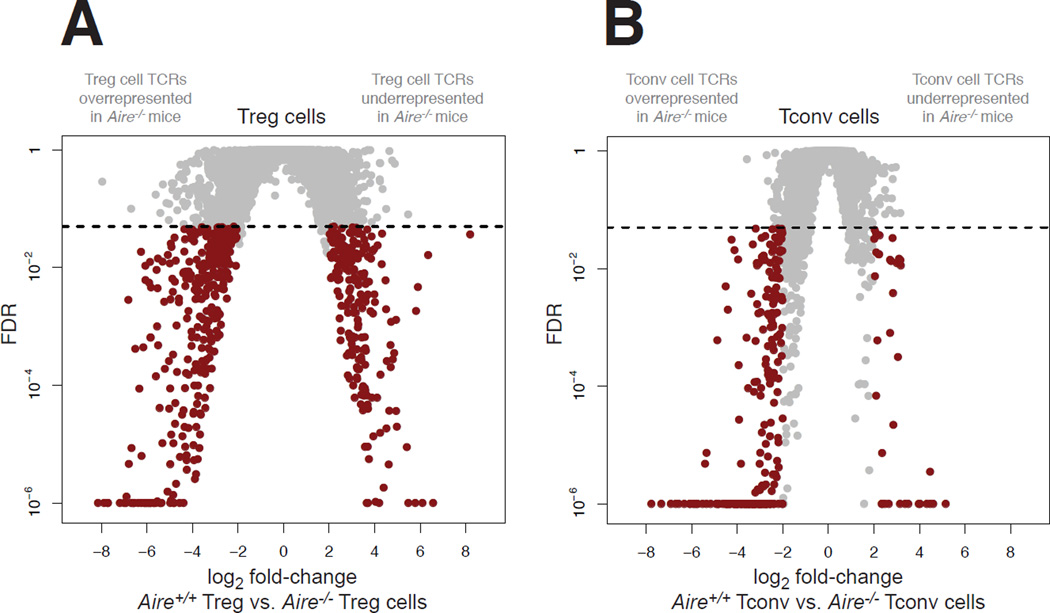
Figure 2. Aire Impacts the CD4+ T Cell Repertoire in the Secondary Lymphoid Organs.
CD4+Foxp3+ Treg cells and CD4+Foxp3neg Tconv cells were purified by FACS from 9-week-old TCRβTg Foxp3GFP males on an Aire+/+ and Aire−/− background, and subjected to complete TCRα sequencing.
(A and B) The impact of Aire on the Treg cell repertoire (A) and Tconv cell repertoire (B) was analyzed via complete TCRα sequencing of T cell populations isolated from the pooled spleen and lymph nodes using the iRepertoire platform (see Experimental Procedures). For the TCRα chain sequences, volcano plots of false discovery rate (FDR) versus differential TCR representation (log2 fold-change) in Aire+/+ mice vs. Aire−/− mice are plotted for Treg cells (A) and Tconv cells (B). 7,955 TCRs are plotted in A, and 6,422 TCRs are plotted in B. Comparisons were made using EdgeR and were adjusted for multiple comparisons (see Experimental Procedures). Red dots denote TCRs with fold-change > 4 and FDR < 0.05. The arms of the volcano plots denoting TCRs that are overrepresented or underrepresented in Aire−/− mice are indicated in gray above each plot. Data points with FDR < 10−6 are plotted at 10−6. Horizontal dashed lines indicate FDR cutoff. N = 4 for Aire+/+ Treg cell samples, N = 5 for Aire−/− Treg cell samples, N = 4 for Aire+/+ Tconv cell samples, N = 5 for Aire−/− Tconv cell samples. See also Figure S1 and Table S1.

