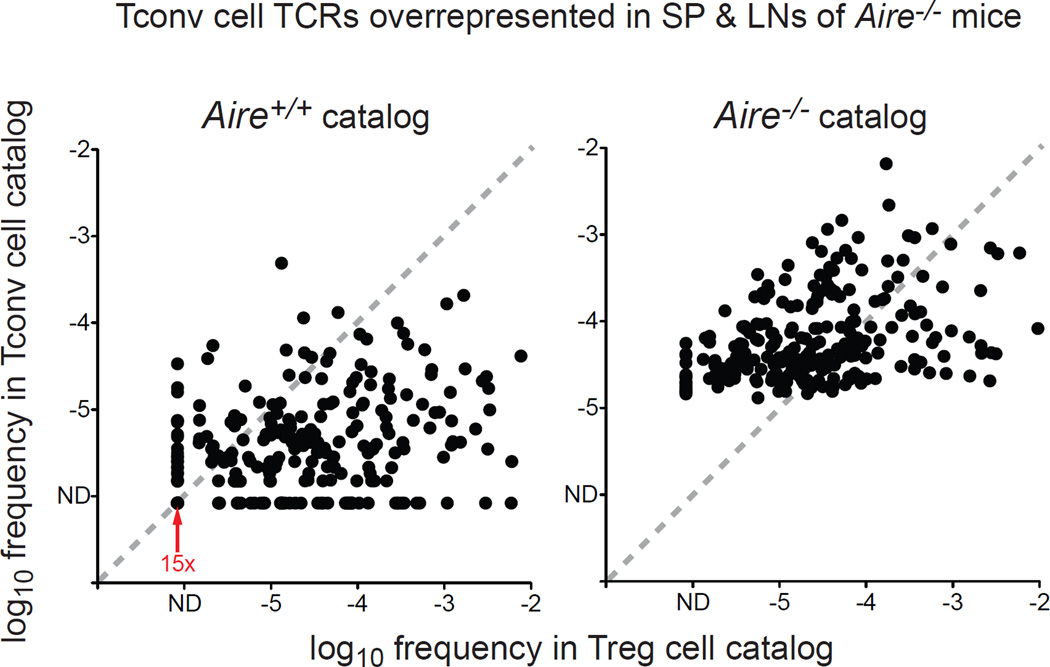
Figure 4. A Large Proportion of Tconv Cell Clonotypes Overrepresented in Aire−/− Mice Are Preferentially Expressed by Treg Cells in Aire+/+ Mice.
For the TCR clonotypes that are recurrently overrepresented in the Tconv cell subset of Aire−/− mice relative to the Tconv cell subset of Aire+/+ mice (denoted in red in left arm of volcano plot in Fig. 2B), the mean frequencies of these clonotypes in the Tconv cell and Treg cell catalogs from Aire+/+ mice (left) and Aire−/− mice (right) are plotted. The shift of many TCRs from below the diagonal in the left plot to above the diagonal in the right plot reflects a shift from preferential representation in the Treg cell subset in Aire+/+ mice to preferential representation in the Tconv cell subset in Aire−/− mice. N = 246 TCRs. The red arrow denotes 15 superimposed data points, representing TCRs that are not detected (ND) in both the Tconv cell and Treg cell catalogs from Aire+/+ mice, suggestive of clonotypes that are deleted in Aire+/+ mice. Of the 246 TCRs shown, 183 TCRs (74%) are biased to the Treg cell lineage (i.e. lie below the diagonal) in the Aire+/+ catalogs. See also Table S1.

