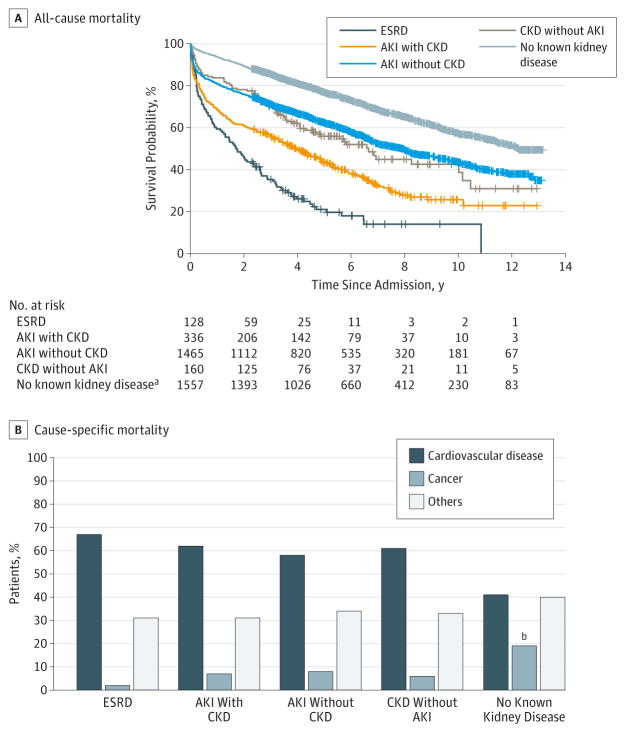
Figure 1. Unadjusted Survival Probability.
Kaplan-Meier survival curves and cumulative survival probabilities are given for patients stratified by kidney disease for all-cause mortality and cause-specific mortality. AKI indicates acute kidney injury; CKD, chronic kidney disease; and ESRD, end-stage renal disease.
aLog-rank P < .001 for comparison of groups with respect to the group with no known kidney disease using Bonferroni adjustment.
bLog-rank P < .05 for comparison with respect to the group with no known kidney disease using Bonferroni adjustment.

