
Figure 1. VG3-ACs provide direct glycinergic input to SbC-RGCs.
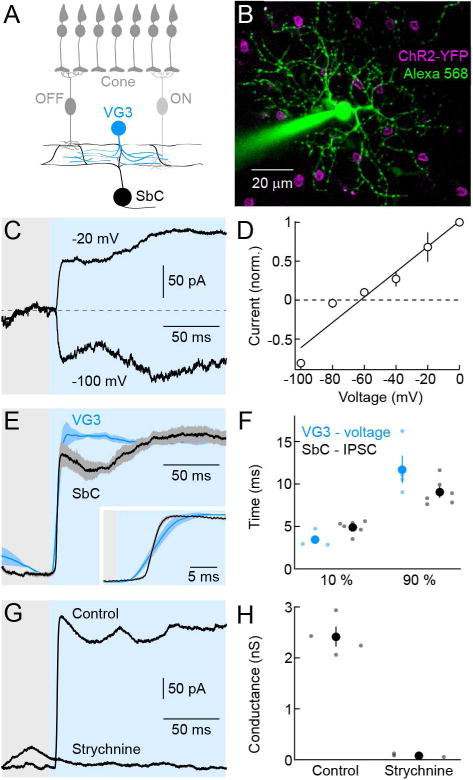
(A) Schematic of the retina. Cone photoreceptors distribute signals to ON and OFF bipolar cells, which converge onto VG3-ACs. Neurites of VG3-ACs overlap with link processes between ON and OFF arbors of SbC-RGC dendrites. (B) Representative SbC-RGC recorded in a VG3-ChR2 retina. The image is a z-axis projection of a 2-photon image stack. Whereas the Alexa 568 signal (green) was projected through the complete stack, projection of the YFP fluorescence (magenta) was restricted to the inner nuclear layer to highlight somata of VG3-ACs. (C, D) Representative traces (C) and summary data (D, mean ± SEM, n = 5) of currents recorded at different holding potentials in SbC-RGCs during optogenetic stimulation of VG3-ACs. (E) VG3-AC voltage (blue) and SbC-RGCs IPSC (black) responses to a bright step of blue light (3.15 * 10−4 W mm−2, 426 – 446 nm, shaded area). Lines (shaded areas) indicate normalized mean (± SEM) responses, facilitating comparisons of response timing. The inset shows responses at the stimulus onset on an expanded timescale. (F) Summary data of the time after stimulus onset before 10 % and 90 % of the peak amplitudes are reached (VG3-AC voltage, blue; SbC-RGC IPSC, black). Dots show data from individual cells (VG3-AC voltage, n = 4; SbC-RGC IPSC, n = 6) and circles (errorbars) indicate mean (± SEM) of the respective population (p < 0.03 for 10 %; p > 0.1 for 90 %). (G, H) Representative IPSC traces (G) and summary data of inhibitory conductances (H) of SbC-RGC elicited by optogenetic stimulation of VG3-ACs in absence or presence of strychnine. Dots represent data from individual cells (control, n = 4; strychnine, n = 3, p < 0.001) and circles (errorbars) indicate mean (± SEM) of the respective population. See also Figures S1 and S2