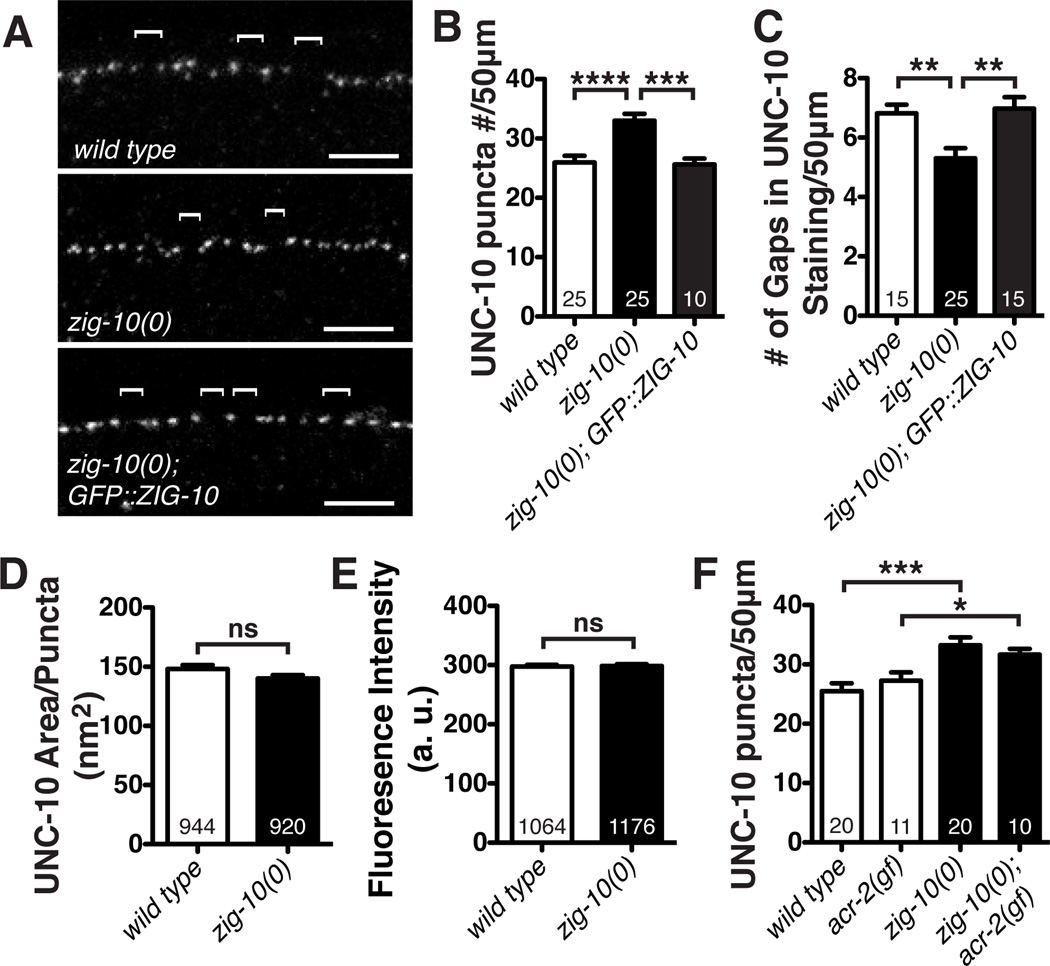
Figure 3. Loss of ZIG-10 increases synapse density.
(A) Representative confocal images of immunostaining for the active zone protein UNC-10 in the dorsal cord. Brackets mark UNC-10 negative gaps greater than 2 µm. (B) zig-10(0) displayed an increased number of synapses. (C) zig-10(0) showed a reduced number of UNC-10 negative gaps between synapses. (D–E) zig-10(0) had a normal active zone area and did not alter UNC-10 staining intensity as measured in arbitrary units (a. u.). (F) zig-10(0) increased the number of synapses in acr-2(gf) background.
The data in B-F are represented as mean ± SEM. ns=not significant, *p<0.05, **p≤0.01, ***p≤0.001, and ****p≤0.0001. Sample size is shown within each bar. See also Figure S3.

