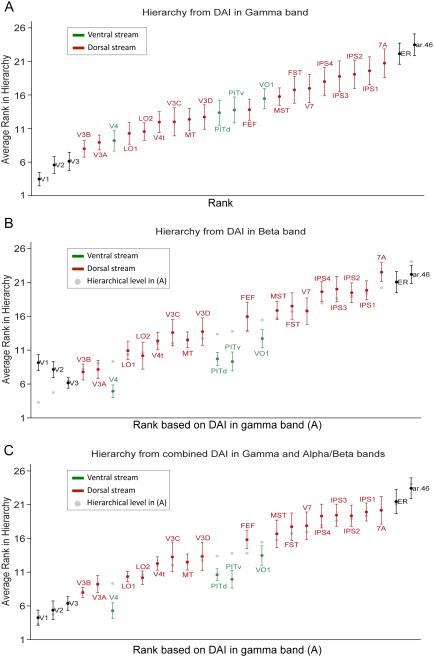
Figure 8. Functional hierarchy of 26 human visual areas.
The functional hierarchy of 26 human visual areas was computed based on (A) DAI in the gamma band, (B) DAI in the alpha-beta band and (C) the combined DAI in alpha-beta and gamma bands. The functional hierarchy in each case is the average of the functional hierarchies in the left and right hemisphere. Ventral-stream areas are depicted in green, dorsal-stream areas in red and all other areas in black. In (A) the 26 areas have been ranked along the x-axis based on their average hierarchical level depicted on the y-axis. In (B) and (C), the ranking from (A) has been preserved on the x-axis in order to illustrate changes in the hierarchy for DAIs of different bands.

