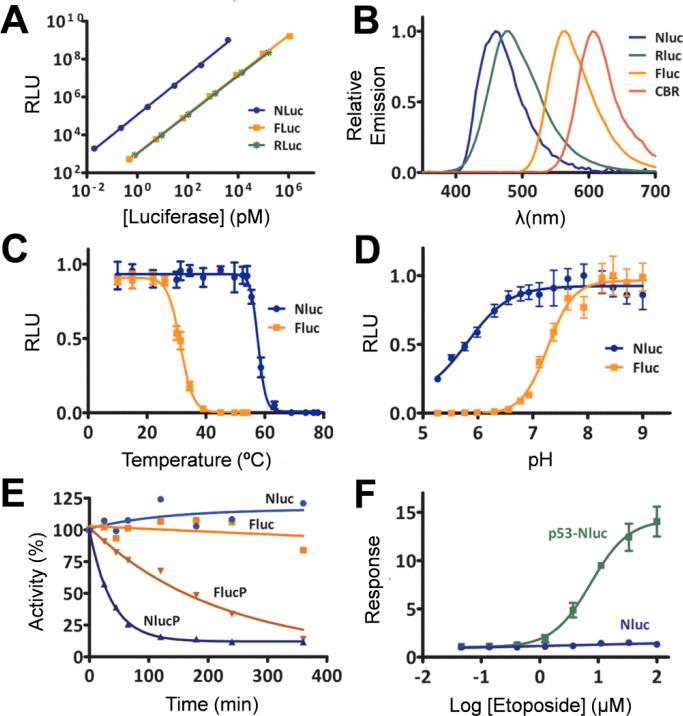
Figure 9.
Comparison of luminescence intensity of NLuc, FLuc, and RLuc at 10 min. Spectral profile of NLuc, RLuc, FLuc, and click beetle red luciferase (CBR), showing a broad range of emission peaks. NLuc and FLuc were compared for sensitivity to (C) temperature and (D) pH. (E) Luminescence measured over time after treatment with cycloheximide to inhibit protein synthesis, showing that NLuc-PEST (NLucP) signal quickly decreased, followed by FLucP. (F) NLuc was used to investigate regulated changes in p53 stability, by expressing p53 –NLuc in HEK293 cells. The addition of etoposide caused an accumulation of p53, which could be measured with furimazine. Adapted with permission from ref. 4. Copyright 2012 American Chemical Society.

