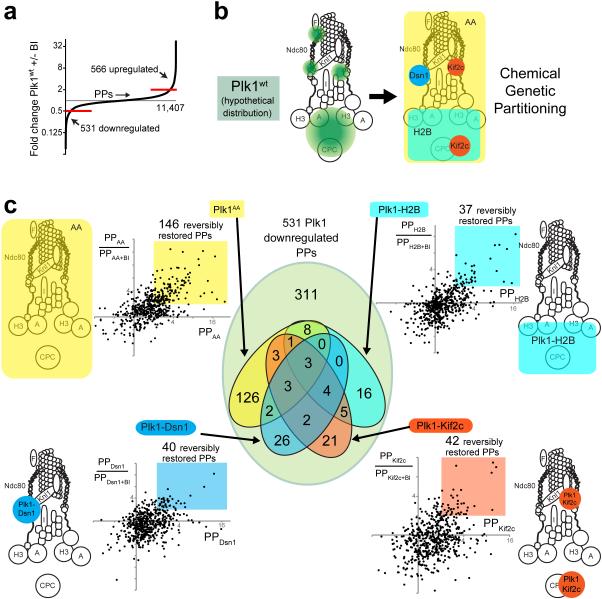
Figure 3. 10-plex TMT phosphoproteomic analysis of Plk1 partitioned by locale within the KT axis.
(a) Distribution of phosphopeptides (PPs) regulated by Plk1 activity. Out of a total of 11,407 phosphopeptides encountered, 566 PPs were upregulated (> 2-fold increase +BI/−BI) and 531 downregulated (> 2-fold decrease +/−BI) with exposure to the Plk1wt inhibitor, BI-2536. (b) Hypothetical distribution of Plk1wt (green) within the KT axis and partitioning function by locale within the KT axis (Dsn1-outer KT, Kif2c-outer KT/inner centromere, H2B-chromatin) or by a delocalized control, (Ch-Plk1AA) (c) Identification of phosphopeptides (PPs) that are restored with each tethered Plk1 construct. Each dot on plot represents one of 531 physiologically Plk1-regulated PPs (downregulated >2x with Plk1wt+BI). The x-axis displays its abundance relative to control (Plk1wt+BI) with values >2 indicating that phosphorylation is restored by the construct in question. The y-axis indicates the ratio PP/PP+BI, with values >2 indicating that the restored PP is depleted with chemical inactivation of the regionally-restricted construct. Color-coded regions indicate the PPs that are reversibly restored with each regional construct. The Venn diagram at center illustrates the number of PPs that overlap by the distinct color-coded constructs.

