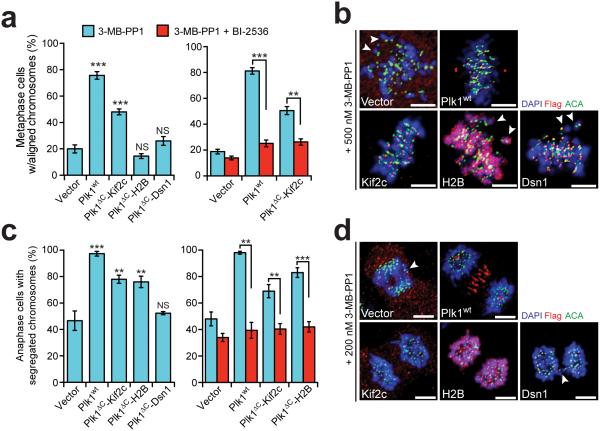
Figure 4. Restricting Plk1 activity along the kinetochore-centromere axis produces distinct phosphoproteomic and functional signatures.
Cells expressing GFP-Plk1as and kinetochore-tethered Plk1 constructs were challenged with 3-MB-PP1 (inhibits Plk1as) ± BI-2536 (inhibits Plk1wt/ Plk1ΔC constructs) and assayed for ability of constructs to rescue chromosome alignment during metaphase or segregation during anaphase. (a) Graphs show average percentage (± SEM) of pre-anaphase mitotic cells at metaphase with fully aligned chromosomes for each cell line (n≥100 cells/experiment; 3 independent experiments). (b) Representative maximal intensity projection micrographs from (a). Arrowheads indicate misaligned chromosomes. (c) Graph shows average percentage (± SEM) of anaphase cells with fully segregated chromosomes for each cell line (n≥40 cells/experiment; at least 3 independent experiments). (d) Representative maximal intensity projection micrographs from (c). Arrowheads indicate lagging chromosomes. **P<0.005, ***P<0.0001 by one-way ANOVA or unpaired t-test; NS, not significant (panels a,c). Scale bars, 5 μm (panels b,d).

