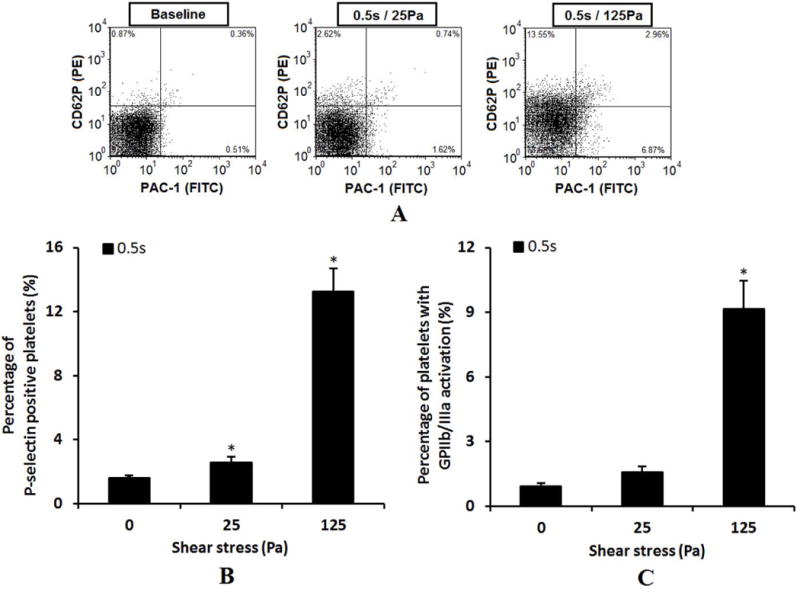
Figure 2.

Comparison of P-selectin expression and GP IIb/IIIa activation among baseline blood sample and the sheared samples (0.5s/25pa and 0.5s/125Pa) using flow cytometry. A: Typical flow cytometry dot plots. The platelets population were identified by scatter gating (gating on forward scatter [FSC] and side scatter [SSC]) of flow cytometer. The percent of platelets with P-selectin expression is indicated by the antibody of PE conjugated anti-CD62P and the percent of platelets with GP IIb/IIIa activation is indicated by the antibody of FITC labeled PAC-1. B: Average percentage of activated platelets indicated by the P-selectin surface expression (n=5). C: Average percentage of activated platelets indicated by the GP IIb/IIIa activation (n=5).
