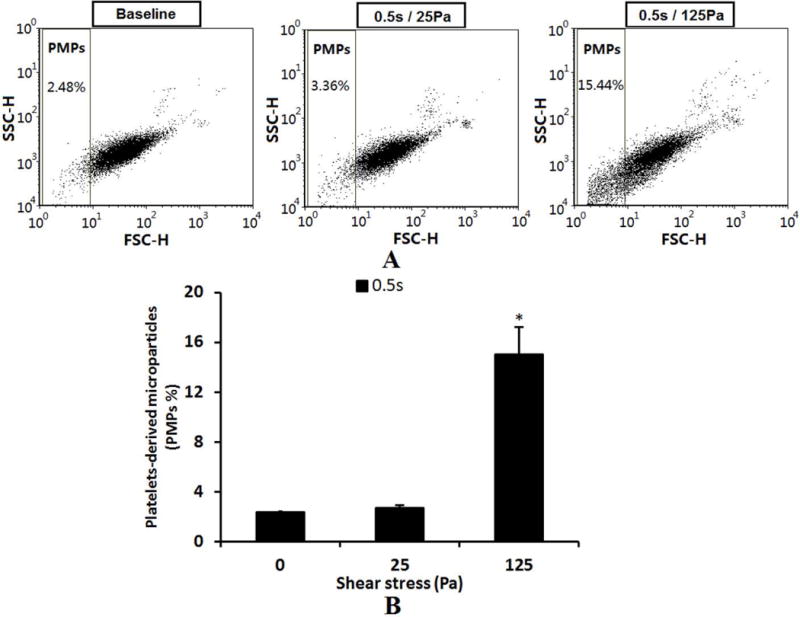
Figure 3.

A: The flow cytometry dot plots of comparing of PMPs among base sample and sheared samples (0.5s/25pa and 0.5s/125Pa). The PMPs were determined by the FSC characteristics of all CD41 positive events. B: The comparison of average percentage of PMPs (n=5).
