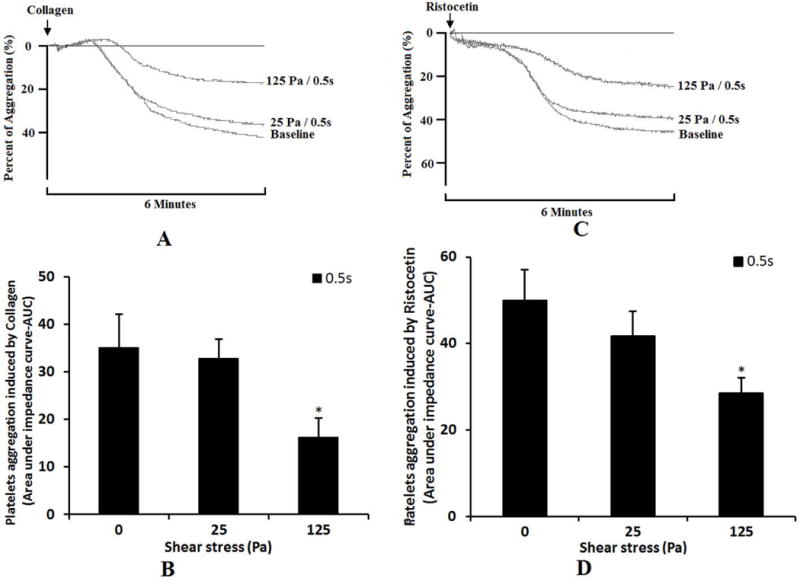
Figure 7.

Comparison of platelet aggregation ability among baseline blood sample and the sheared samples (0.5s/25pa and 0.5s/125Pa) using the aggregometer. A: The changing of impedance curve (aggregation curve) of the platelets aggregation induced by collagen. The platelet aggregation is indicated by area under the impedance curve. The time course of the platelets aggregation curve changing was recorded for 6 minutes. B: The average comparing of platelet aggregation induced by collagen (n=5). C: The changing of impedance curve (aggregation curve) of the platelets aggregation induced by ristocetin. D: The average comparing of platelet aggregation induced by ristocetin (n=5).
