
Figure 5.8.4.
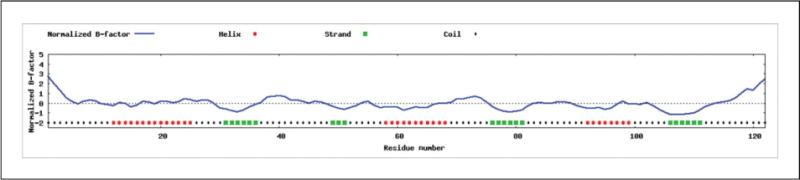
Prediction on the normalized B-factor. The regions at the N- and C-terminals and most of the loop regions are predicted with positive normalized B-factors in this example, indicating that these regions are structurally more flexible than other regions. On the other hand, the predicted normalized B-factors for the alpha and beta regions are negative or close to zero, suggesting these regions are structurally more stable.