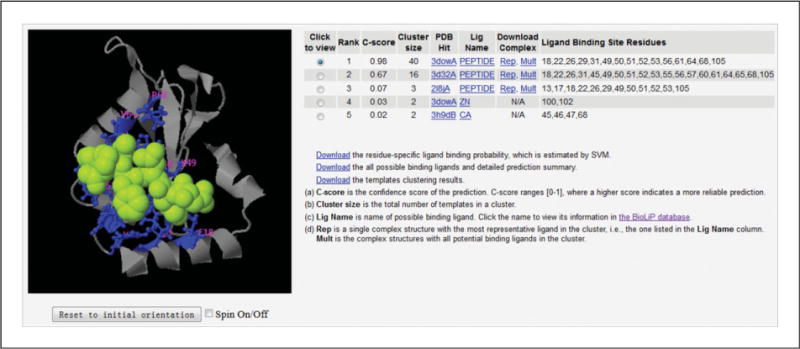
Figure 5.8.8.

Illustration of ligand binding site prediction. The binding site prediction shown on the table is made by COACH, which combines the prediction results from five complementary algorithms of COFACTOR (Roy et al., 2012), TM-SITE, S-SITE (Yang et al., 2013b), FindSite (Brylinski and Skolnick, 2008), and ConCavity (Capra et al., 2009). The predicted binding ligand is highlighted in yellow-green spheres, with the corresponding binding residues shown as blue ball-and-stick illustrations in the picture of the 3-D model. In this example, the first functional template (PDB ID: 3dowA) has a high confidence score (C-score = 0.98) that it binds with a peptide ligand. Except for the predicted peptide, the protein can also bind to other ligands, which are available in a PDB file at the ‘Mult’ link. The ligands separated by ‘TER’ are put in the end of this file.
