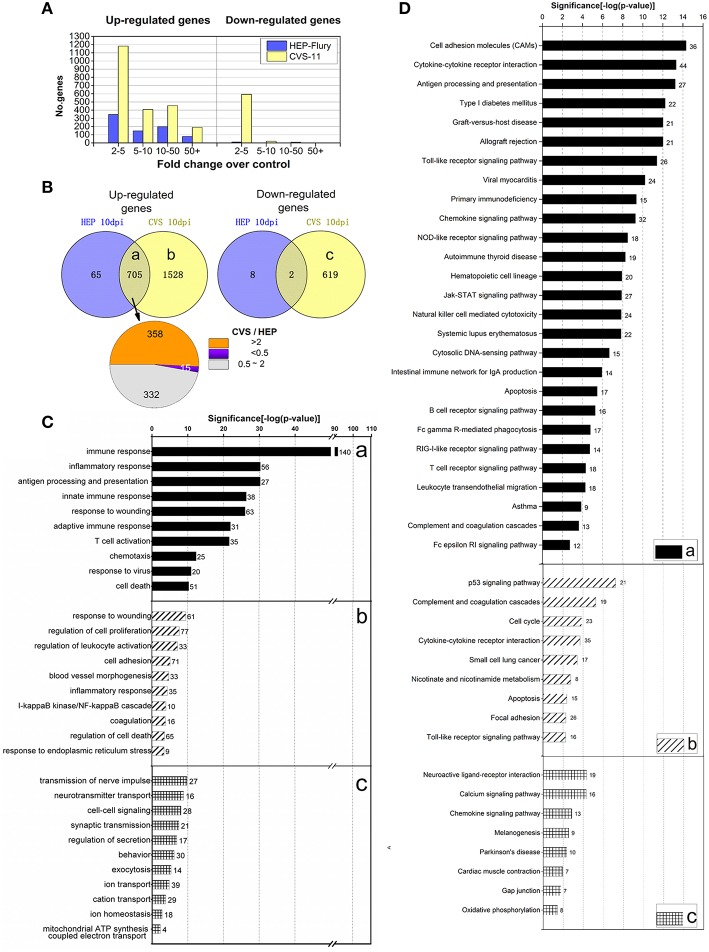
Figure 2.
Differential gene expression profiles in the mouse brain tissue following CVS-11 and HEP-Flury infection at 10 dpi. (A) Graph showing the number and fold change of up-regulated and down-regulated genes (a threshold of ≥2-fold change in expression levels and adjusted P < 0.05) following virus infection. (B) A Venn diagram depicting the overlap of differentially expressed genes, and pie chart showing the number of genes that were up-regulated at different levels. (C) The representative GO terms of the common or unique, differentially regulated genes. (D) The representative KEGG pathways of the common or unique, differentially regulated genes. For more details, see the Supplementary Tables 2–9.

