
Figure 1.
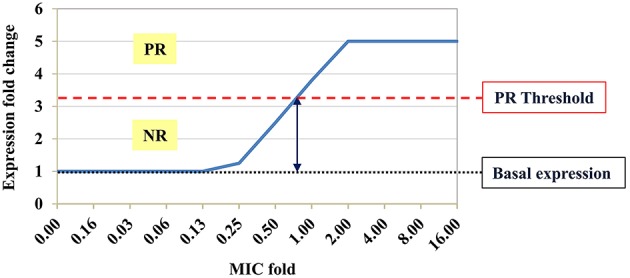
Schematic expression profile of a potential marker gene. Hypothetical pattern of a potential marker gene expression profile following exposure to an antibiotic at sub-MIC, MIC and above the MIC. Basal expression of the tested marker gene in the growth control sample (black dotted line) was defined as fold change (FC) = 1. Expression FC < threshold value (red dashed line) was defined as a negative response (NR), whereas FC ≥ threshold value was defined as a positive response (PR) to the antibiotic. The MIC derived from the molecular AST is the minimal antibiotic concentration that leads to PR.