
Figure 5.
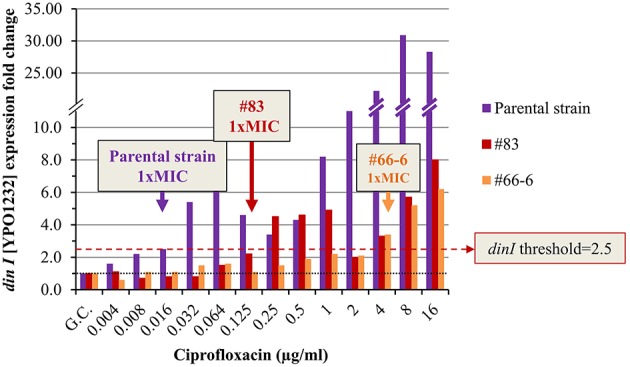
Expression pattern of dinI [YPO1232] in non-virulent Y. pestis Kimberley53pCD1−pPCP1− and its derivatives #83 and #66-6. The molecular AST was performed as described in Figure 4. The black dotted line represents basal expression (FC = 1) in the growth control sample, and the red dashed line represents the threshold value assigned to dinI [YPO1232] (FC = 2.5). The figure is representative of duplicate analyses.