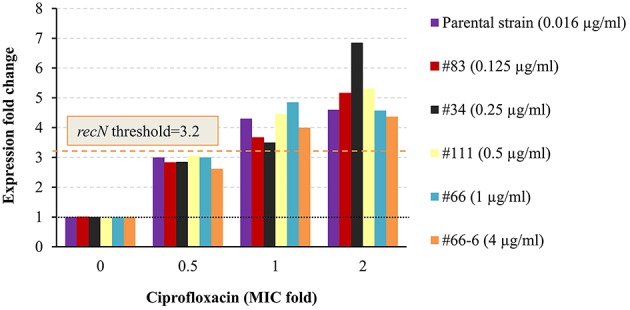
Figure 6.

Expression pattern of recN in non-virulent Y. pestis EV76 and Kimberley53pCD1pPCP1− and its derivatives. The molecular AST was performed as described in Figure 4. For each derivative, the corresponding MIC (as determined by the standard microdilution assay) is given in parenthesis. The black dotted line represents basal expression (FC = 1) in the growth control sample, and the orange dashed line represents the threshold value assigned to recN (FC = 3.2). The figure is representative of duplicate analyses.
