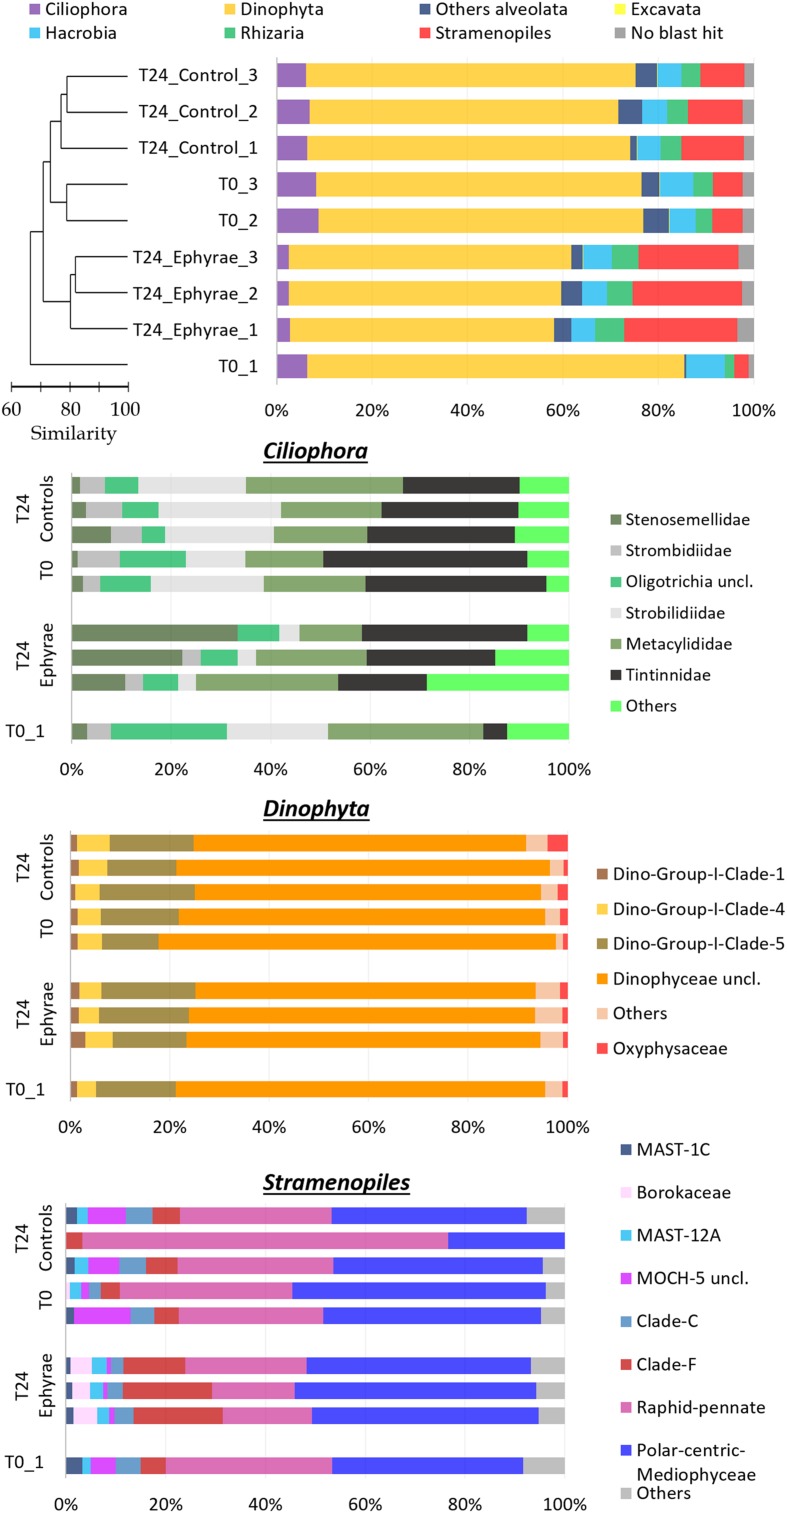
FIGURE 4.
Profiles of the protist community composition obtained with the NGS technique. (Top) The major phyla (major division for phylum Alveolata), with the profiles ordered according to the cluster analysis shown next to the Y-axis. (Bottom) Three bar plots showing the family compositions of Ciliophora, Dinophyta, and Stramenopiles. Taxa with RAs < 1% were grouped as “Others” (RA < 5% for Ciliophora).

