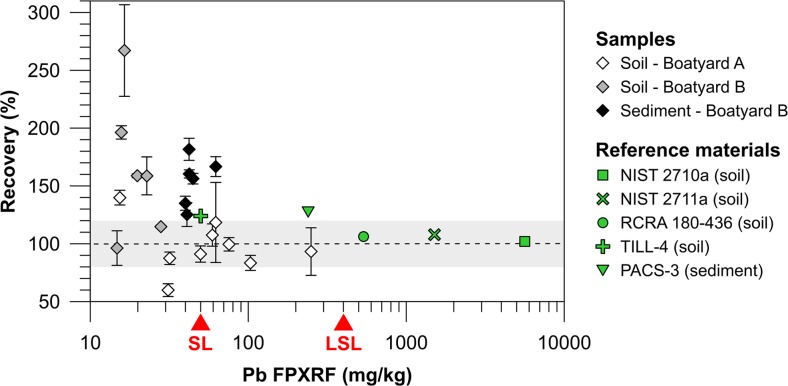
Fig. 3.
Recovery of the ex situ XRF measurements (white, gray, and black diamonds) compared to ICP-OES values or, for the reference materials (green symbols), to certified/recommended values plotted against the concentration measured ex situ by the XRF. The red triangles indicate the concentrations of the Swedish guideline values for soil for sensitive land use (SL) and less sensitive land use (LSL). The gray area shows a recovery of 100 ± 20 %

