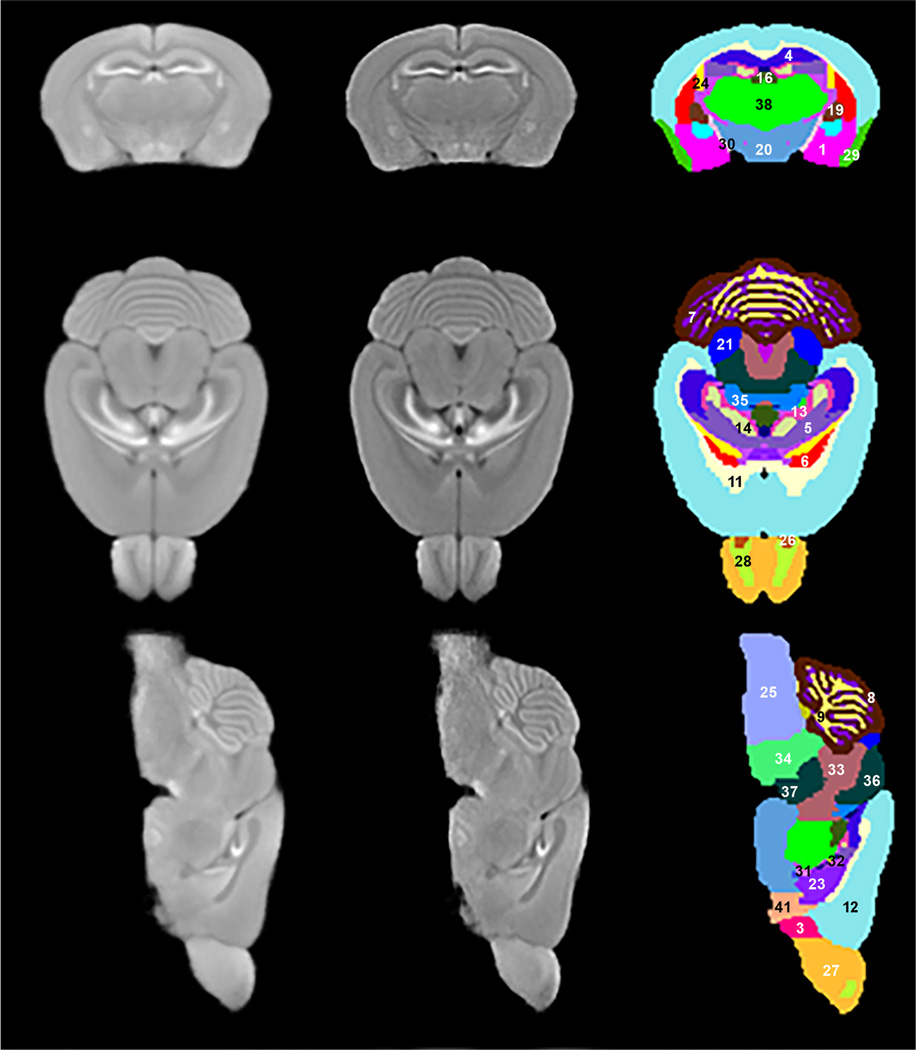
Fig. 1.
Columns: First: Three orthogonal planes of population average MRI. Second: Edge enhancement of images in first column. Third: Identified structures on these planes: 


 (Note: Structures (2) ac, (10) AQ, (15) DN, (17) RFB, (18) FN (22) IP, (39) V3, and (40) V4 are not presented in the third column of the figure)

