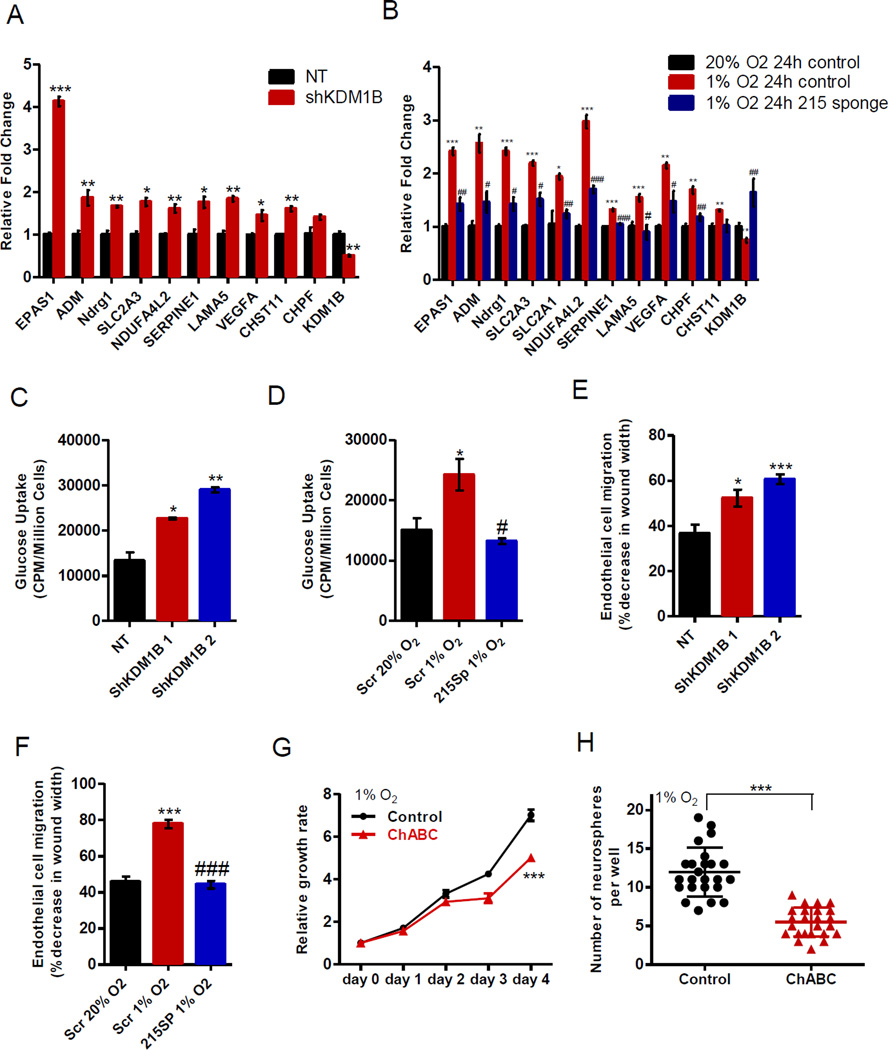
Figure 6. KDM1B mediates responses to hypoxia in GICs through modulating multiple processes.
(A–B) Expression profiles of genes associated with the enriched pathways downstream of miR-215-KDM1B were measured in 110040 GICs with the indicated modifications. n=3.
(C, D) Glucose uptake rate was measured in 110040 GICs with indicated modifications. n=3.
(E, F) Cell scratch assay was performed to measure the relative migration rate of immortalized human microvascular endothelial cells cultured in the conditional media derived from 110040 GICs with indicated modifications. n=3.
(G–H) Cell growth rate (G) or neurosphere formation assay (H) was measured in 110040 GICs treated with 0.05U/ml chondroitinase ABC when cultured under 1% O2. n=4 for cell growth assay.
Data are represented as the mean ± SEM. (*,# p<0.05, **,## p<0.01, ***,### p<0.001, *, compared 1% O2 24h control to 20% O2 24h control; #, compared 1% O2 24h 215 sponge to 1% O2 24h control)
See also Figure S7.

