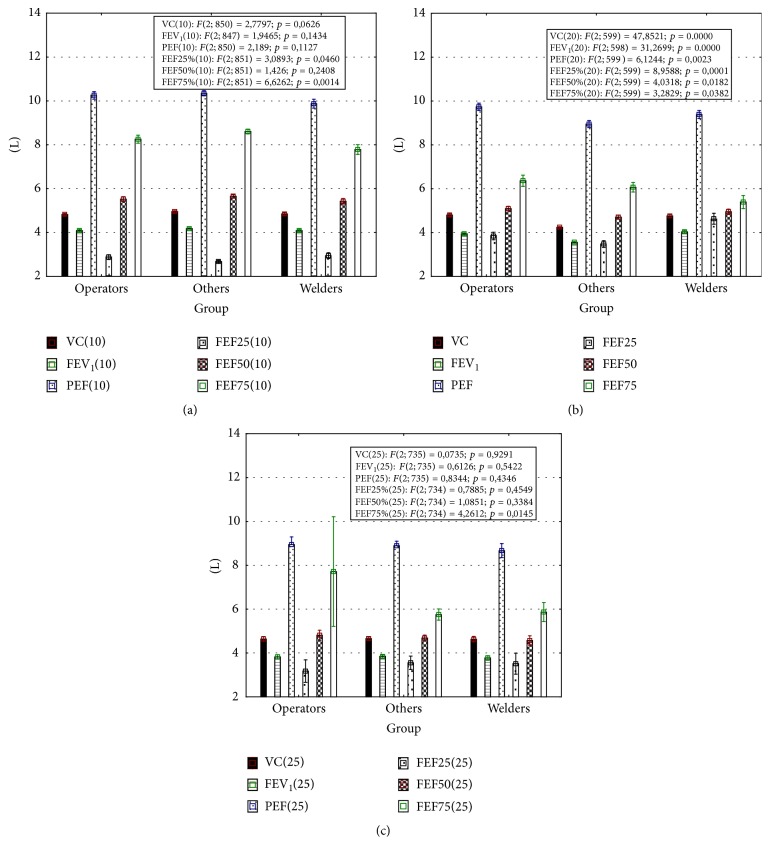
Figure 4.
Absolute spirometric indices after 10 (a), 20 (b), and 25 (c) years of work. Results are presented as mean ± standard error. In frames results of ANOVA F-test were presented. This test was used to assess whether any of the workplaces is on average superior, or inferior, to the others versus the null hypothesis that all three workplaces yield the same mean response in lung function.

