
Figure 1.
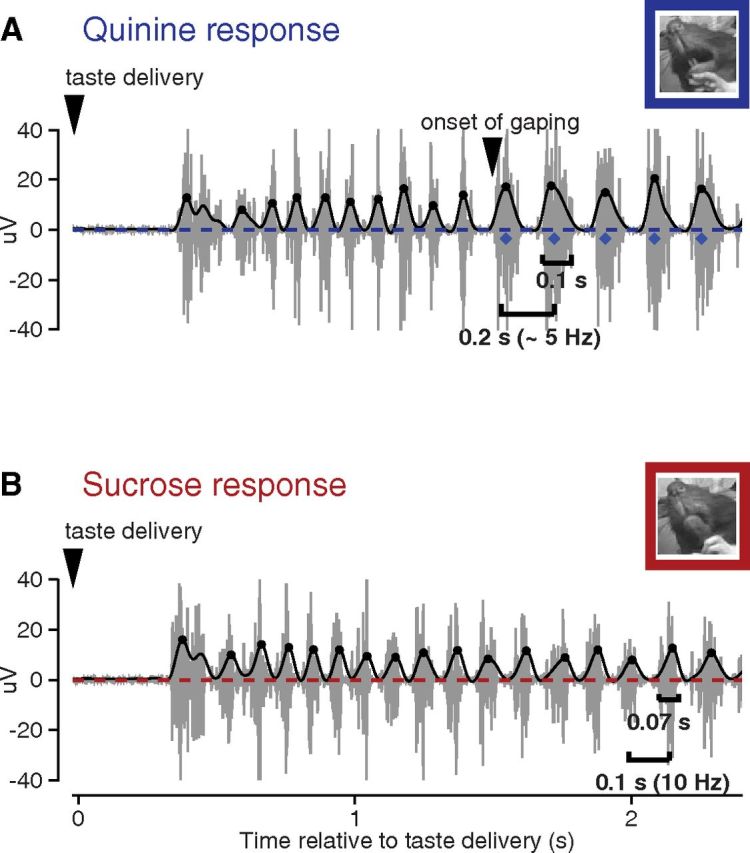
Jaw EMG activity to aversive versus pleasurable taste stimuli. A, The gray trace plots the EMG activity in the jaw of a rat following a single delivery of sQ. The overlaid thick line is the output of rectifying and low-pass filtering the data for the calculation of jaw movement peaks (circles), gapes (diamonds), and the time at which the first gape appears; a video frame from during that first gape is shown in the inset. B, Same as A, but for sS; note the absence of gapes. The video frame is taken from during the (putative) first LTM. Note that palatability-related responses are preceded by a period during which the EMG signal is flat (i.e., the basic response latency) and a period during which nondistinctive licks occur (taste processing).