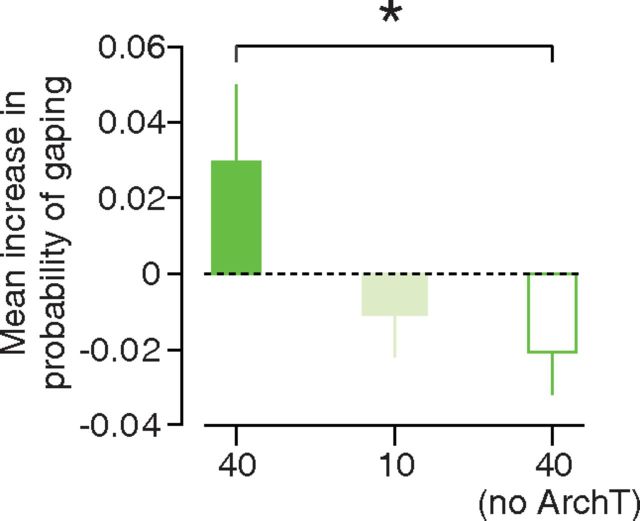
Figure 6.
Impact of GC inactivation on the lick—gape transition. A bar plot illustrating the effect of GC inactivation on the probability that the animal will produce gapes in the 2.5 s following sQ delivery (y-axis) for three separate experimental groups: ArchT animals exposed to 40 mW laser light (bright green bar), ArchT-expressing animals exposed to 10 mW laser light (light green bar), and virus-free animals exposed to 40 mW laser light (white bar with green border). The height of each bar quantifies the difference in behavior between the light-on and light-off trials for the experimental group. Positive values indicate that the light-on trials were more likely to contain gapes. Error bars in the plot represent SEs; *p = 0.04.

