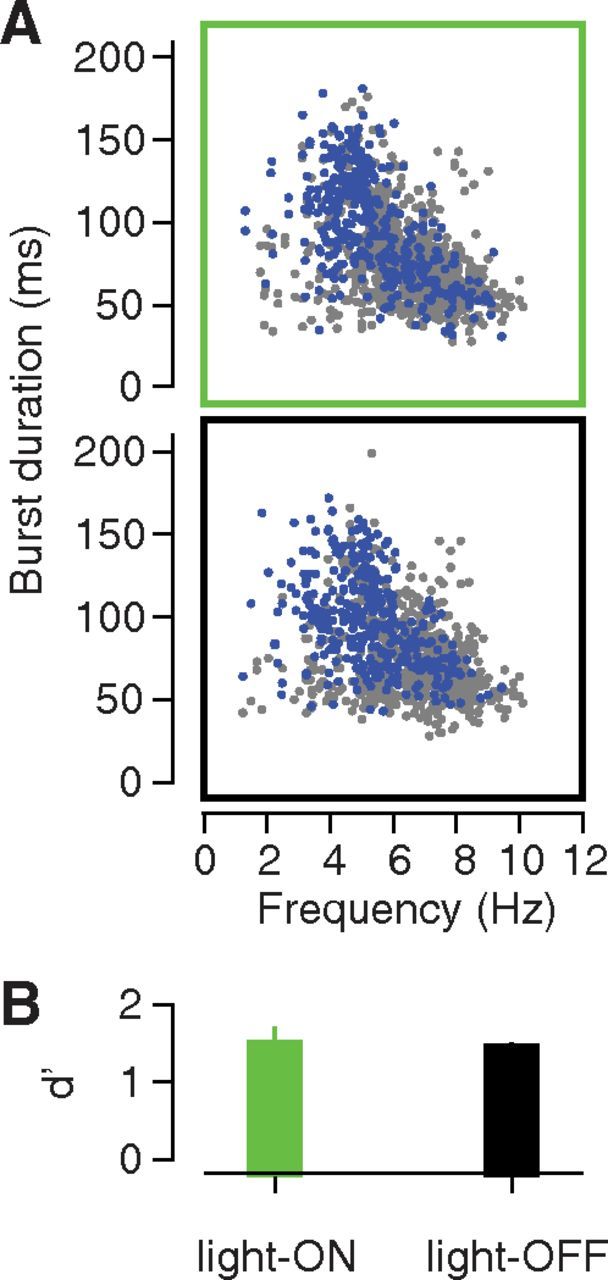
Figure 7.

Impact of GC inactivation on the duration and frequency of individual licks and gapes. A, Comparison of mouth movement duration and frequency in four virus-infected animals during light-on (top) and light-off (bottom) trials. Each symbol represents a separate mouth movement, with video-coded gapes in blue, and non-gapes in gray. B, Performance of the gape detection algorithm for the light-on sQ trials (green bar) vs for the light-off sQ trials (black bar). Error bars indicate the SEM across animals (N = 4). The laser was set to 40 mW for all light-on trials.
