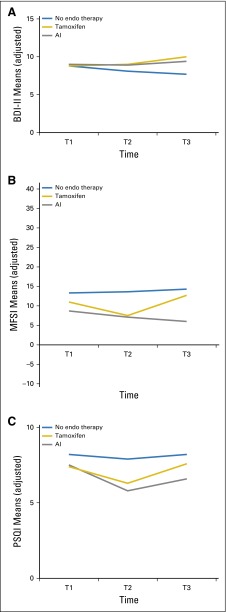
Fig 4.
Longitudinal trajectories of adjusted mean depressive symptom, fatigue, and sleep problem scores at baseline (T1) and at 6 months (T2) and 12 months (T3) of follow-up. Means were adjusted for age, education, time since last treatment, and chemotherapy. (A) Depressive symptoms, measured by the Beck Depression Inventory II (BDI-II). (B) Fatigue severity, measured by the Multidimensional Fatigue Symptom Inventory (MFSI); P = .11 for overall group-by-time interaction; P = .53 for group differences at T1; P = .23 for group differences at T2; and P = .09 for group differences at T3. (C) Sleep problems, measured by the Pittsburgh Sleep Quality Index (PSQI; adjusted means) by type of endocrine (endo) therapy at three time points. AI, aromatase inhibitor.

