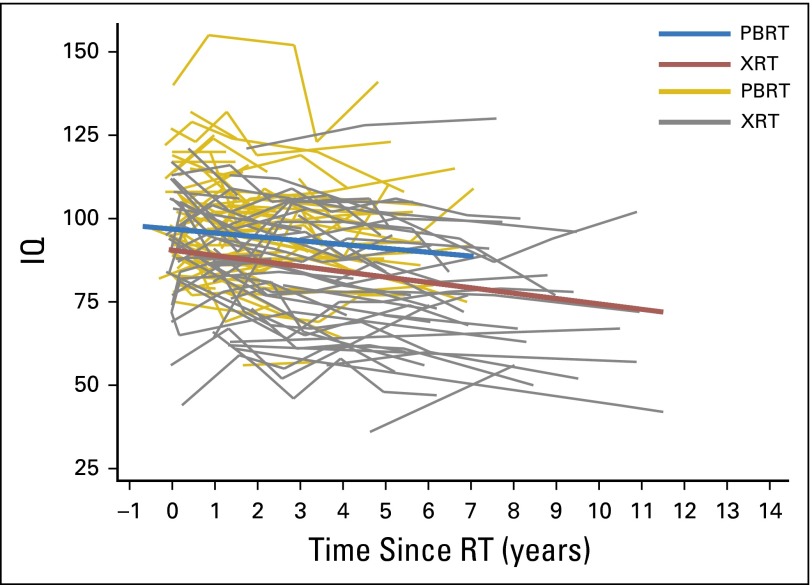
Fig 1.
Bold lines represent the regression lines of IQ change over time since RT for each RT group, on the basis of average values for all variables included in the model (Table 2). Fine lines represent unadjusted change in IQ over time for individual patients. IQ, intelligence quotient; PBRT, proton beam radiation therapy; RT, radiation therapy; XRT, photon radiation therapy.

