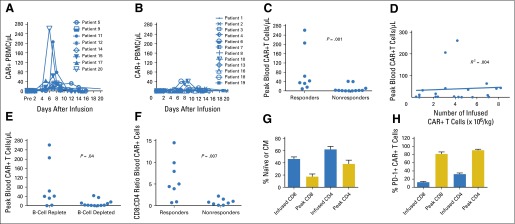
Fig 4.
High peak blood levels of anti-CD19 chimeric antigen receptor (CAR19) T cells were associated with remissions of malignancy. (A) The absolute numbers of blood T cells that contained the CAR gene were assessed by quantitative polymerase chain reaction (qPCR) before infusion and at multiple time points after infusion. Results for patients who obtained a response of either a complete remission (CR) or a partial remission (PR) are shown. (B) The absolute numbers of T cells that contained the CAR gene were assessed by qPCR for all patients with malignancies that did not respond to CAR19 T cells. Lack of response was defined as a response of stable disease (SD) or progressive disease (PD). (C) The peak numbers of blood CAR-positive (CAR+) T cells were higher in responders (patients obtaining CR or PR) than in nonresponders (patients with SD or PD). CAR+ T cells were measured by qPCR. P = .001 by Mann-Whitney test. (D) Linear regression analysis of the number of infused CAR+ T cells per kilogram for each patient versus the peak number of blood CAR+ T cells for each patient was performed. Blood CAR+ T cells were measured by qPCR. The peak CAR+ T-cell level was not predicted by the number of infused CAR+ T cells (R2 = 0.004). (E) Patients with blood B-lymphocyte counts above the lower limit of normal before CAR19 T-cell infusion (B-cell replete) had higher peak blood CAR+ T-cell levels than patients with low blood B-lymphocyte counts before CAR19 T-cell infusion (B-cell depleted). CAR+ T cells were measured by qPCR. The normal range for blood B lymphocytes is 81 to 493/mL. B lymphocytes were defined as CD19+ lymphocytes, which included both normal lymphocytes and chronic lymphocytic leukemia lymphocytes. The median blood B-cell count for B-cell–replete patients was 322/μL. The median blood B-cell count for B-cell–depleted patients was 1/μL. The groups were compared by Mann-Whitney test. For (C), (D), and (E), analysis was performed on all 20 treated patients. (F) Flow cytometry staining with a monoclonal antibody specific for CAR19 was performed. Cells were also stained for CD3, CD4, and CD8. The CD8:CD4 ratios of CD3+ CAR+ cells were calculated. Flow cytometry was performed on peripheral blood mononuclear cells (PBMCs) obtained 5 to 14 days after CAR T-cell infusion during the time of each patient’s peak CAR19 blood level. The fraction of CAR19 T cells that were CD8+ was higher for patients with responses of CR or PR (responders) than for patients with outcomes of SD or PD (nonresponders). The groups were compared by Mann-Whitney test. (G) Flow cytometry was performed on a sample of the infused T cells or on PBMCs from the time of each patient’s peak CAR19 T-cell level between 5 and 14 days after infusion. For this analysis, naïve T cells were defined as cells with a CD45RA+ C-C chemokine receptor type 7–positive (CCR7+) phenotype, and central memory (CM) T cells were defined as cells with a CD45RA− CCR7+ phenotype. A substantial fraction of the CAR+ T cells had a naïve or CM phenotype at the time of infusion. For both CD8+ and CD4+ T cells, the fraction of CAR-expressing T cells with a naïve or CM phenotype decreased between the time of infusion and the time of peak blood levels of CAR19 T cells. The mean and SEM are shown for each category. The Wilcoxon matched pairs signed rank test was used to compare the fraction of naïve plus CM cells among the infused CAR-expressing T cells to the fraction of naïve plus CM cells among CAR-expressing T cells from the time of peak blood CAR T-cell levels (for both CD8+ and CD4+ T cells, P < .001). (H) Flow cytometry to detect programmed cell death protein-1 (PD-1) was performed on a sample of the infused T cells or on PBMCs from the time of peak CAR19 levels. The fraction of both CD8+ and CD4+ CAR+ T cells expressing PD-1 increased between the time of infusion and the time of peak blood CAR19 T-cell levels. The mean and SEM are shown for each category. By the Wilcoxon matched pairs signed rank test, P < .001 for both the CD8 and the CD4 comparisons. For (F), (G), and (H), analyses were performed on all 16 patients with detectable blood CAR19 T cells and available blood samples.

