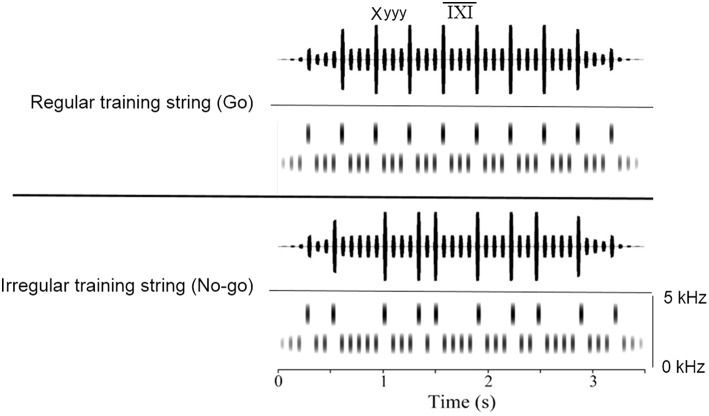
Figure 1.
Visualization of the regular and the irregular training strings. The X-elements are indicated by the taller lines and the y-elements by the shorter lines. The IXI is the interval between two X-elements, measured from onset to onset. Note the fade-in and fade-out phases at beginning and end of the stimuli.

