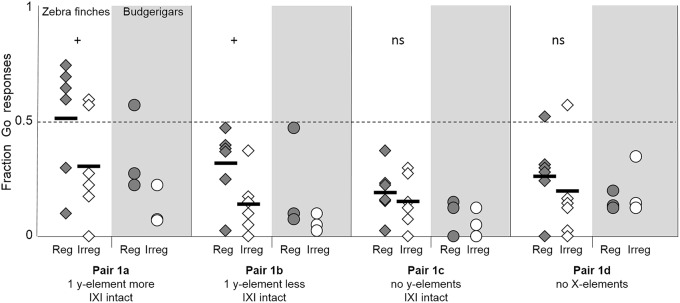
Figure 3.
Fraction of Go-responses toward the regular test strings (shaded diamonds) and the irregular test strings (open diamonds) for the four pairs of test set 1. Horizontal bold lines shown the average fraction of Go responses of the six zebra finches. + symbols indicate a trend (0.05 < p < 0.10) toward a difference between the responses to the Go and to the No-go strings, ns indicates no significant difference (data for zebra finches only). Individual budgerigar results are shown with shaded circles (regular strings) and open circles (irregular strings). They were not tested at group level.

