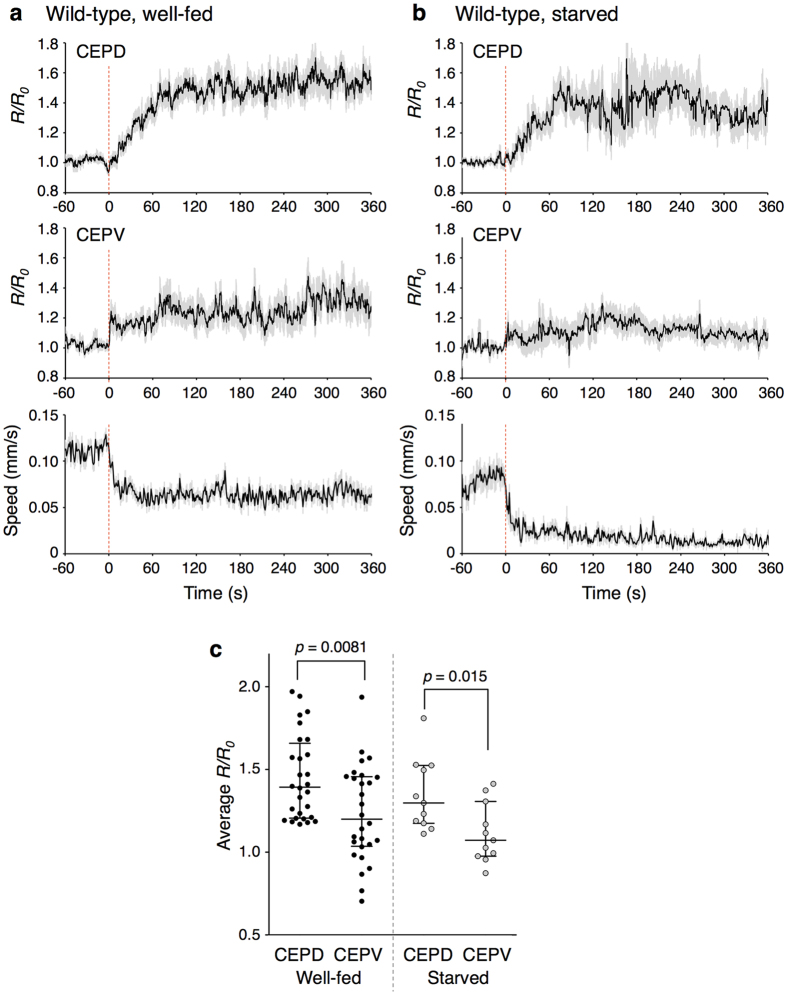
Figure 3. CEPD and CEPV neuron pairs were asymmetrically activated upon food entry.
(a,b) Responses of CEPD (top) and CEPV (middle) as well as speed (bottom) of well-fed (a) or starved (b) wild-type animals upon food entry are shown. The time when an animal entered a bacterial lawn was determined as t = 0. The R/R0 values (average ± SEM) are shown. The responses of CEPD and CEPV were monitored from the same animals. Twenty-eight and 11 animals were analysed for well-fed and starved conditions, respectively. When the average R/R0 value was lower than 1.1 in both of CEPD and CEPV in an animal, that animal was regarded as “not responding”, and those data were excluded. (c) Scatter plot comparing averaged R/R0 values between CEPD and CEPV of well-fed (left) or starved (right) wild-type animals upon food entry. A two-tailed Mann-Whitney test was used for the statistical analysis.

