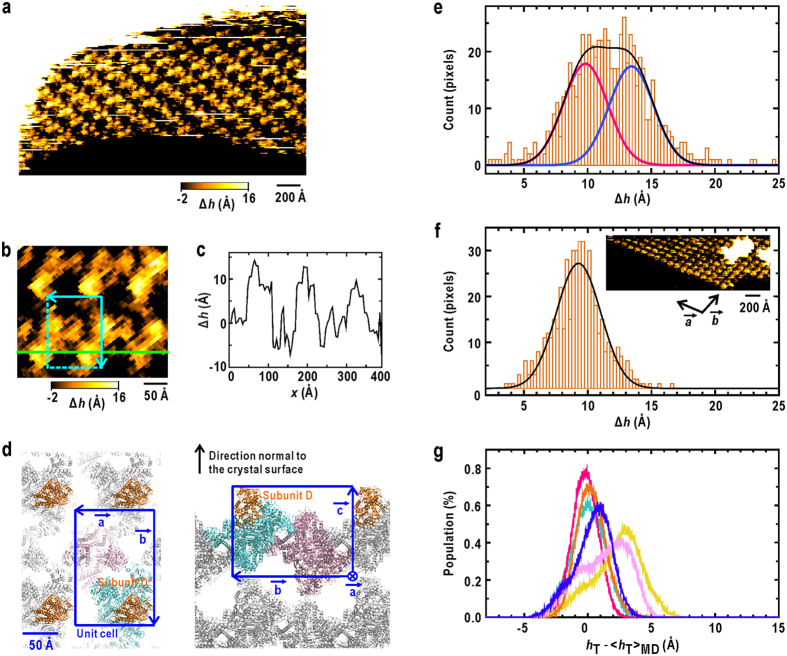
Figure 3. AFM measurements on the surface of GDH crystals.
(a) A topography after the tilt-correction of the crystal surface against the horizontal movement of the piezo-scanner. ∆h is the height from the average plane of the image. (b) A magnified view of the topography shown in (a). The cyan box is a unit cell. (c) The height profile along the green line in (b) is shown. (d) The illustrations showing molecular packing mode of GDH in the monoclinic crystal22,23, viewed normal to the a-b plane (left panel) and along the a-axis (right panel). The blue boxes are unit cells. (e) The height distribution (orange bars) of N-domain of subunit D from the AFM surface topography for GDH crystals. The distribution is approximated by the sum (black curve) of two Gaussians (red and blue curves) with the standard deviation values determined from the AFM topography for the surface of haemoglobin crystals. (f) The height distribution (orange bars) of subunits of haemoglobin in the AFM topography (inset). The black curve is a Gaussian with the standard deviation of 3.4 Å approximating the height distribution. (g) Simulated height distribution of N-domain from the MD trajectory of each subunit. The colouring scheme is the same as in Fig. 1b. hT is the height of the centroid of residues 277–287 at the tip of N-domain of subunit D along the direction normal to the crystal surface (Supplementary Note 1 and Supplementary Fig. S3).  is the average over the MD trajectories. The total sum of distributions is approximated by two Gaussians.

