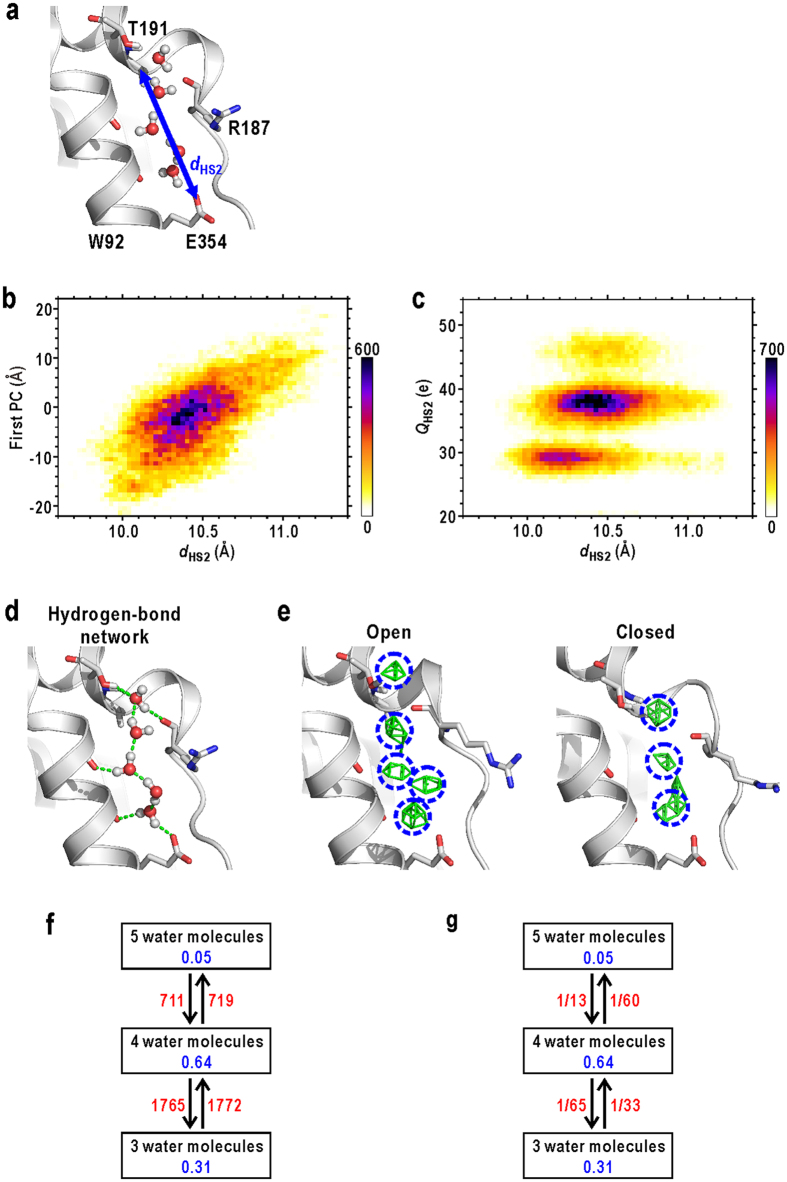
Figure 6. Conformational and hydration changes at HS2.
(a) An illustration defining dHS2. (b) A heat map displaying the dependence of the N-domain motion, represented by the first PC, on dHS2. The shown map is for the data of subunit A, and that for the merged data of all subunits is shown in Supplementary Fig. S9c. (c) A heat map displaying the relation between dHS2 and QHS2 of subunit A. The map for the merged data of all subunits is shown in Supplementary Fig. S9d. (d) A typical example of the H-bond network at HS2. (e) Solvent density maps in the open and closed conformations. Regions used to monitor QHS2 are indicated by blue circles. (f) The time-course of QHS2 in the 200-ns MD trajectory. The frequencies (f) and rate constants (g) between the conformational and hydration states at HS1 (red coloured characters). The unit for rates is ps−1. Blue coloured characters are the population of each state.

