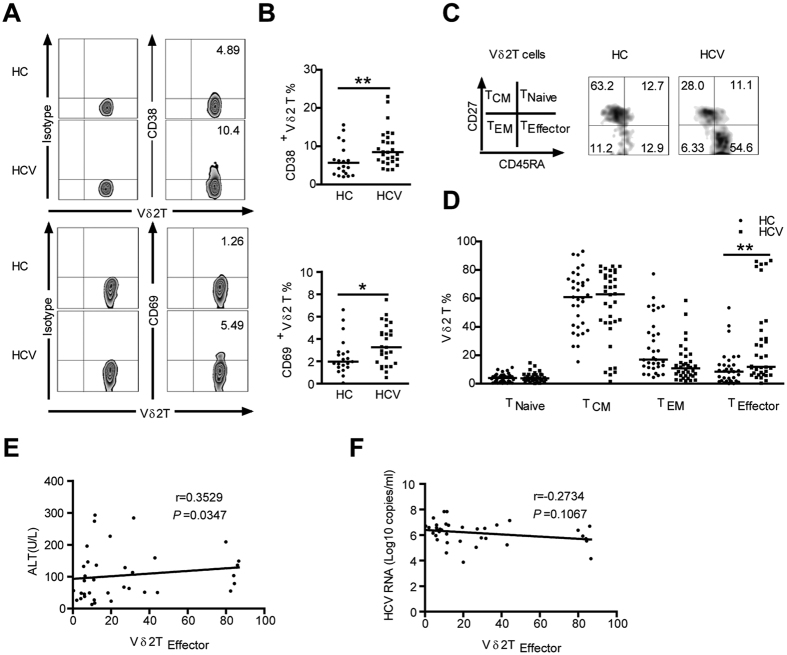
Figure 1. Vδ2 T cells in HCV-infected patients show an activated terminally differentiated effector phenotype.
(A) Representative flow cytometry panels depict the expression of the activation markers CD38 and CD69 on Vδ2 T Cells from HCs and HCV-infected patients. (B) Frequency of Vδ2 T cells expressing CD38 and CD69 in HCs and HCV-infected patients. n = 21 and 27 for HC and HCV, respectively. (C) Distribution of Vδ2 T cell subsets in representative individuals from HCs and HCV-infected patients. Differentiation was analyzed by monitoring CD27 and CD45RA expression. (D) Vδ2 T cell differentiation profile from HCs and HCV-infected patients. n = 33 and 36 for HC and HCV, respectively. Horizontal lines indicate the median. (E,F) Correlation analysis of the percentages of Vδ2 TEffector cells and the serum ALT levels (E) or HCV RNA loads (F) in HCV-infected patients. n = 36. *p < 0.05, **p < 0.01.

