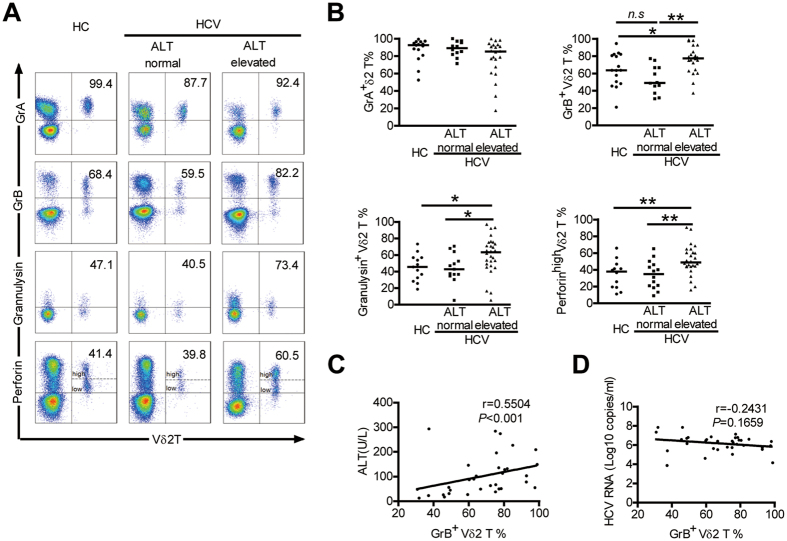
Figure 3. Enhanced cytolytic enzymes production by Vδ2 T Cells associates with liver damage in HCV-infected patients.
(A) Representative dot plots depict the expression of GrA, GrB, Granulysin and perforin on Vδ2 T cells from HCV-infected patients with elevated ALT levels and from those with normal ALT levels and HCs. (B) Frequency of Vδ2 T cells expressing GrA, GrB, Granulysin (gated on CD3 + T cells) and perforin (gated on lymphocytes) in each group. GrA, n = 15 and 12 and 22, respectively; GrB, n = 16 and 12 and 22, respectively; Granulysin, n = 13and 13 and 28, respectively; perforin, n = 12 and 14 and 26, respectively. Horizontal lines indicate the median. (C,D) Correlation analysis of the percentages of GrB + Vδ2 T cells and the serum ALT levels (C) or HCV RNA loads (D) in HCV-infected patients. n = 34. *p < 0.05, **p < 0.01.

