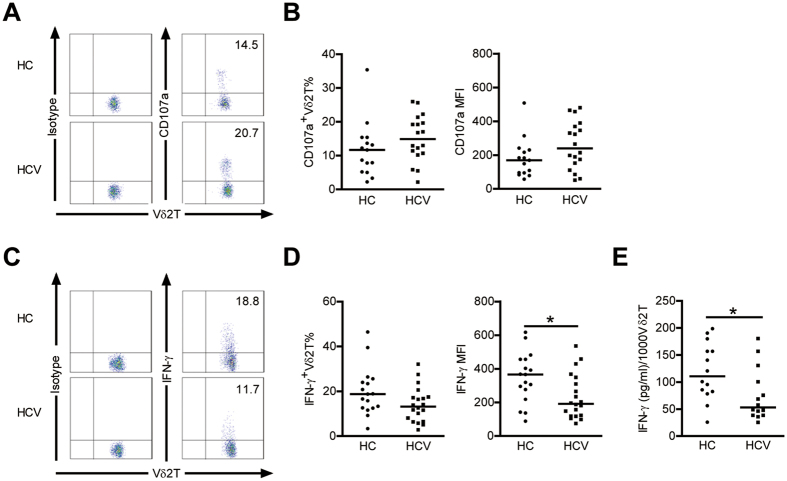
Figure 4. Vδ2 T cells display enhanced degranulation but decreased IFN-γ production in patients with chronic HCV.
(A) Representative dot plots depict CD107a expression on Vδ2 T cells from HCs and HCV-infected patients. (B) Frequency and mean fluorescence intensity (MFI) of Vδ2 T cells expressing CD107a in HCs and HCV-infected patients. n = 15 and 18 for HC and HCV, respectively. (C) Representative dot plots depict IFN-γ expression on Vδ2 T cells from HCs and HCV-infected patients. (D) Frequency and mean fluorescence intensity (MFI) of Vδ2 T cells expressing IFN-γ in HCs and HCV-infected patients. n = 17 and 20 for HC and HCV, respectively. (E) A quantitative analysis of IFN-γ produced by Vδ2 T cells from HCs and HCV-infected patients was performed by ELISA assay. Results (pg/ml of IFN-γ) were normalized for 1000 Vδ2 T cells. n = 14 for each group. Horizontal lines indicate the median. *p < 0.05.

