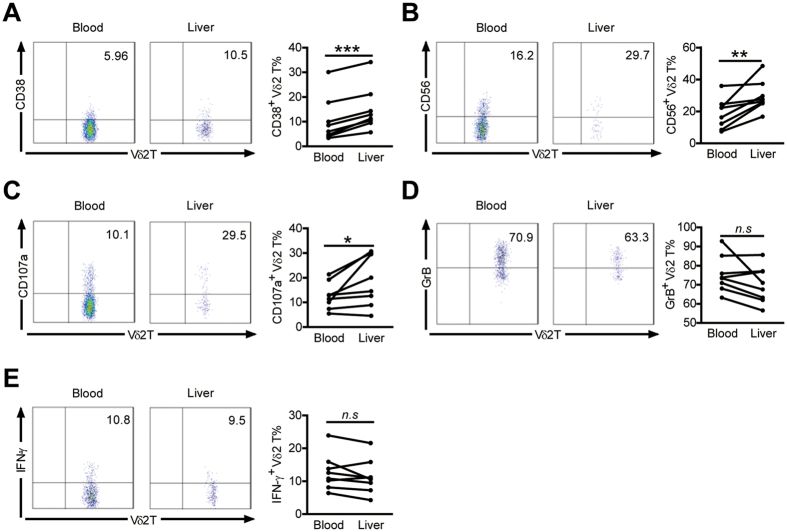
Figure 5. Expression of activation and cytotoxic markers by hepatic Vδ2 T cells is higher than those in peripheral blood in HCV-infected patients.
(A,B,D) The proportions of Vδ2 T cells expressing CD38 (A), CD56 (B), GrB (D) were compared in HCV-infected patients with paired liver and blood samples. n = 8 for each group. (C,E) The proportions of Vδ2 T cells producing CD107a (C) and IFN-γ (E) upon zoledronate stimulation are also shown. n = 8 for each group. *p < 0.05, **p < 0.01, ***p < 0.001.

