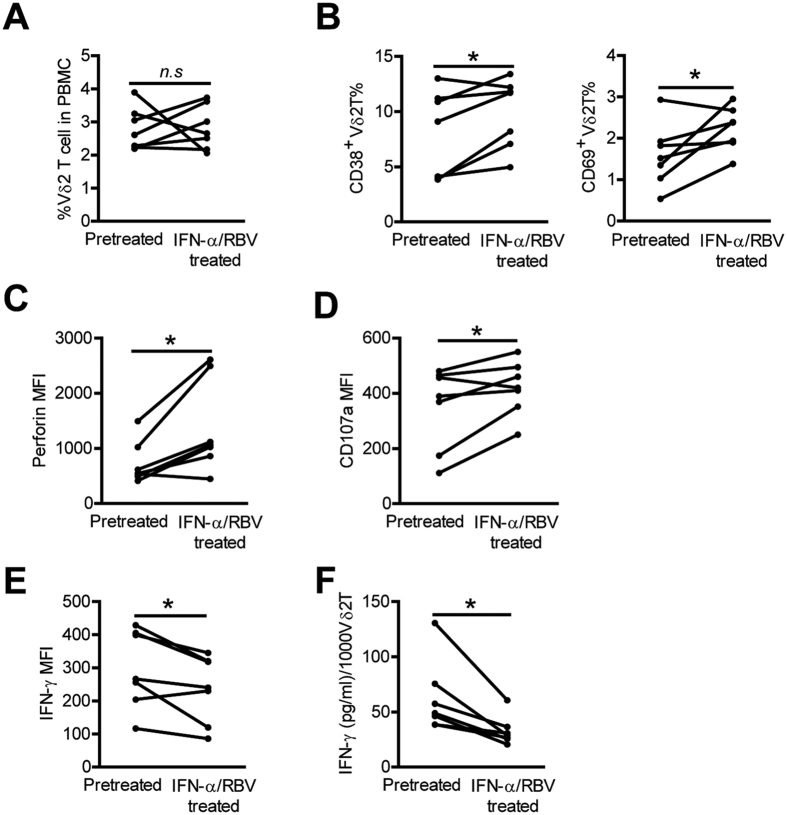
Figure 8. In vivo IFN-α administration further enhances Vδ2 T cell activation and cytolytic activity but decreased Vδ2 T cell IFN-γ production in HCV-infected patients.
(A–C) The frequency of Vδ2 T cells (A), and expression of activation markers CD38 and CD69 (B), and cytolytic enzyme perforin (C), on Vδ 2 T cells was detected by flow cytometry before and after one month HCV therapy. n = 7 for each group. (D,E) Expression of CD107a (D) and IFN-γ (E) on Vδ2 T cells before and after one month HCV therapy following zoledronate stimulations was also analyzed by flow cytometry. n = 7 for each group. (F) Supernatant levels of IFN-γ released in culture by Vδ2 T cells before and after one month HCV therapy after zoledronate stimulation were quantified by ELISA. Results (pg/ml of IFN-γ) were normalized for 1000 Vδ2 T cells. n = 7 for each group. *p < 0.05.

