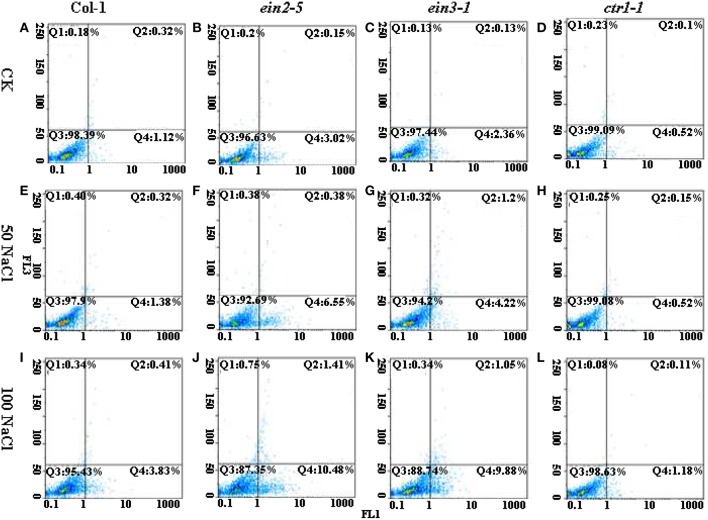
Figure 2.
Flow cytometric pictures of PCD occurrence among four lines of Arabidopsis plants under the control or saline conditions. Seedlings of Col-0, ein2-5, ein3-1, and ctr1-1 were treated with 0, 50, or 100 mM NaCl. The protoplasts were stained with AnnexinV (FL1 channel) and PI (FL2 channel), and then analyzed by FCM. The Q4 Zone indicates early PCD cells; The Q2 Zone indicates late PCD cells; The Q3 Zone indicates intact cells. (A) The seedling of Col-0 were treated with 0 mM NaCl. (B) The seedling of ein2-5 were treated with 0 mM NaCl. (C) The seedling of ein3-1 were treated with 0 mM NaCl. (D) The seedling of ctr1-1 were treated with 0 mM NaCl. (E) The seedling of Col-0 were treated with 50 mM NaCl. (F) The seedling of ein2-5 were treated with 50 mM NaCl. (G) The seedling of ein3-1 were treated with 50 mM NaCl. (H) The seedling of ctr1-1 were treated with 50 mM NaCl. (I) The seedling of Col-0 were treated with 100 mM NaCl. (J) The seedling of ein2-5 were treated with 100 mM NaCl. (K) The seedling of ein3-1 were treated with 100 mM NaCl. (L) The seedling of ctr1-1 were treated with 100 mM NaCl.

