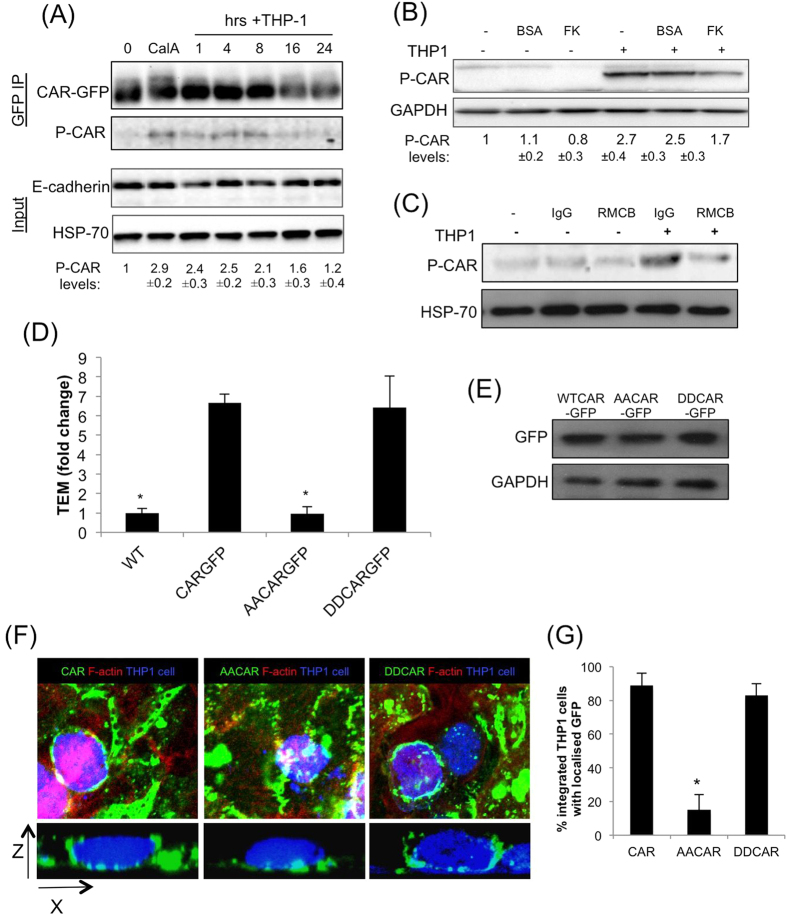
Figure 2. CAR promotes THP-1 transmigration in a phosphorylation dependent manner.
(A) THP-1 cells were added to CAR-GFP HBEC monolayers for the times indicated. Cells were then lysed and immunoprecipitated with anti-GFP antibodies followed by western blotting using antibodies against p-CAR, and GFP. Total cell lysates were probed for E-cadherin and HSP-70 as loading controls. Calyculin A (CalA) treatment was used as a positive control to induce p-CAR. Values beneath blots are relative levels of p-CAR compared to time 0 from 4 independent experiments + /−SEM. (B) Western blot of phosphorylated CAR as in (A) following 4 h incubation with THP-1 cells with or without pre-treatment with 100 μg/ml FK or BSA as a control. Values beneath blots are relative levels of p-CAR compared to untreated from 4 independent experiments + /−SEM. (C) Western blot of phosphorylated CAR as in (A) following 4 h incubation with THP-1 cells with or without pre-treatment with 10 μg/ml RMCB CAR function blocking antibody or IgG as a control. Values beneath blots are relative levels of p-CAR compared to untreated from 4 independent experiments + /−SEM. (D) THP-1 transmigration analysis performed as in (A) using WT, CAR-GFP, AACAR-GFP and DDCAR-GFP HBEC. Error bars are SEM. Statistical significance compared with CAR-GFP HBEC is shown. (E) Representative western blot of levels of CAR-GFP in specified cells lines. (F) Example confocal images of THP-1 cells undergoing trans-epithelial migration. Cell tracker orange stained THP-1 cells were added to confluent monolayers of HBEC and fixed after 24 hours before confocal imaging to obtain z-stacks. Cell tracker orange THP-1 cells (blue), CAR-GFP (green) and actin (red) to show the position of the HBEC are shown. Z-slice and maximum intensity projection show the location of THP-1 in relation to HBEC monolayer and recruitment of CAR-GFP to THP-1. (G) Quantification of % of cells with lateral associated CAR-GFP in images as from (F) Data is mean of 18 fields of view over 3 independent experiments. For all data where relevant * = p < 0.005 compared to CAR-GFP.

