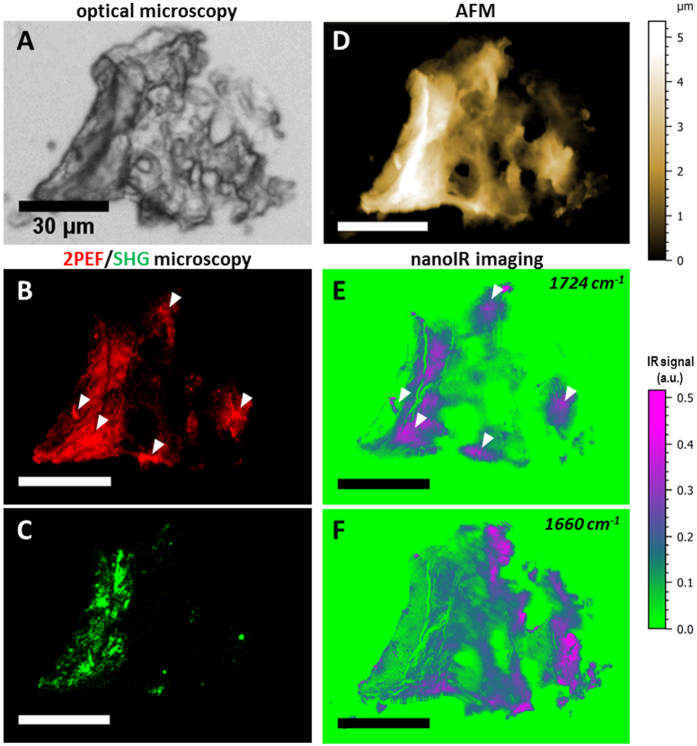
Figure 6. Correlative imaging of Maritime map sample scrap.
Correlative (A) optical microscopy, (B) 2PEF microscopy, (C) SHG microscopy, (D) AFM topography, nanoIR mapping at (E) 1724 cm−1 and (F) 1660 cm−1. Arrows in the 2PEF microscopy image (B) show hot fluorescent areas in the cluster and are correlated with the nanoIR mapping at 1724 cm−1, corresponding to the gel-carbonyl band.

