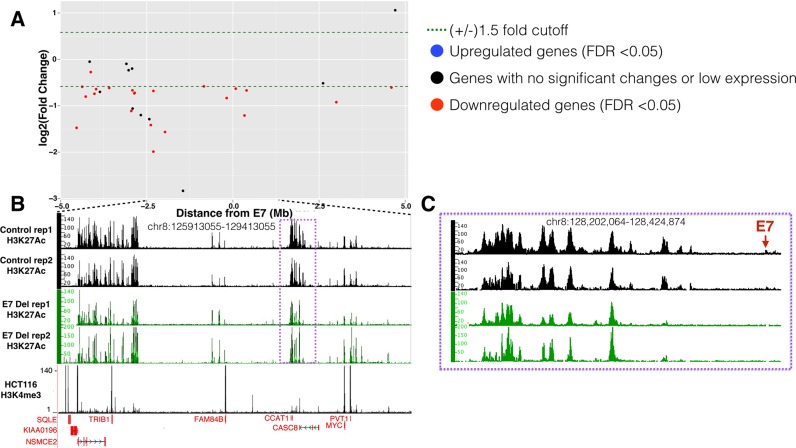
Figure 3.
Gene expression and H3K27Ac changes upon deletion of E7 in HCT116 cells. (A) The Y-axis shows log2 fold changes in gene expression in the E7-deleted cells throughout a +/− 5 Mb region from E7, with genes showing decreased expression upon enhancer deletion having negative numbers and genes showing increased expression upon enhancer deletion having positive numbers. (B) Shown are the H3K27Ac patterns in independent replicates of control and enhancer-deleted cells within an ∼3 Mb region near the E7 enhancer (located within the purple box, which is shown in an expanded view in panel C). Also shown is the H3K4me3 pattern to identify promoter regions. The Y-axis indicates the peak height and the X-axis indicates the genomic location; only those genes significantly downregulated in the deleted cells are indicated in red below the H3K4me3 track. (C) The H3K27Ac patterns in control and deleted cells are shown for the region nearby E7 (red arrow), showing loss of the E7 H3K27Ac peak, as well as loss of H3K27Ac signal at the right side of the nearby large enhancer region.

