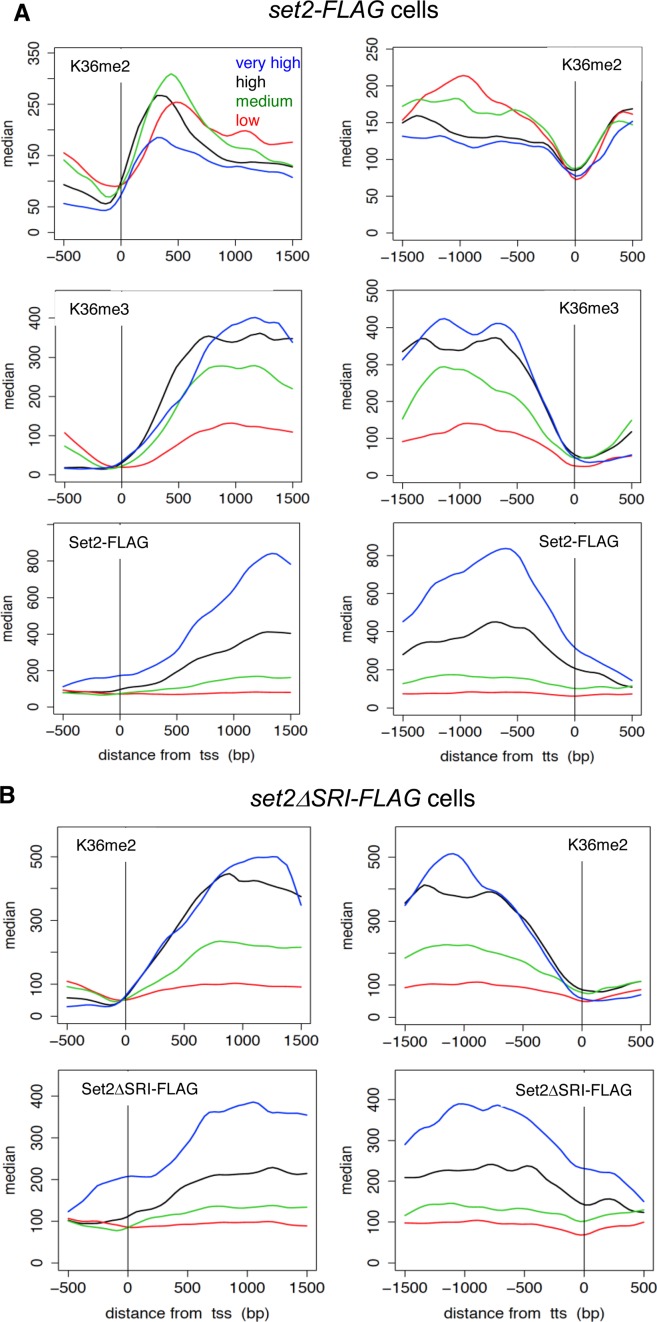
Figure 2.
Distributions of methylation of H3K36 and Set2 proteins indicate co-transcriptional methylation by Set2. (A) ChIP-sequencing analysis of H3K36me2, H3K36me3 and Set2-FLAG in wild-type (set2-FLAG) cells. Positions (bp) relative to the transcription start site (TSS) (left panels) and termination site (TTS) (right panels) are shown on the x-axis. The gene sets (very high, high, medium, low) used were the same as those used in the previous study (42), which were classified according to the level of Pol2. The median tag counts of the indicated gene sets, which were transcribed at different levels, are shown on the y-axis in each upper panel. (B) ChIP-sequencing analysis of H3K36me2 and Set2ΔSRI-FLAG in set2ΔSRI-FLAG cells. Positions (bp) relative to the transcription start site (TSS) (left panels) and termination site (TTS) (right panels) are shown on the x-axis. The median tag counts of the indicated gene sets, which were the same as used in (A), are shown on the y-axis in each upper panel.

