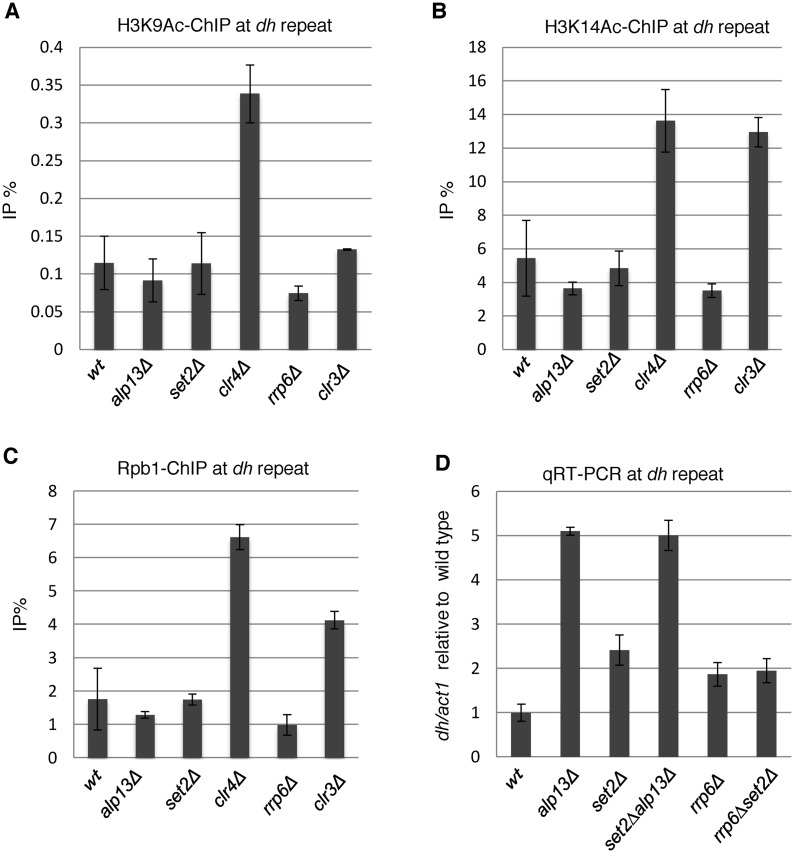
Figure 6.
Comparison of the states of heterochromatin among possible downstream factors of Set2. (A and C) ChIP analyses of H3K39Ac (A), H3K14Ac (B) and Rpb1 (C) at heterochromatic dh repeats in the indicated strains. Error bars show the standard deviation of three independent experiments. (D) Quantitative RT-PCR (qRT-PCR) analysis of the forward transcript from dh repeats was performed using the indicated strains. Error bars show the standard deviation of three independent experiments.

