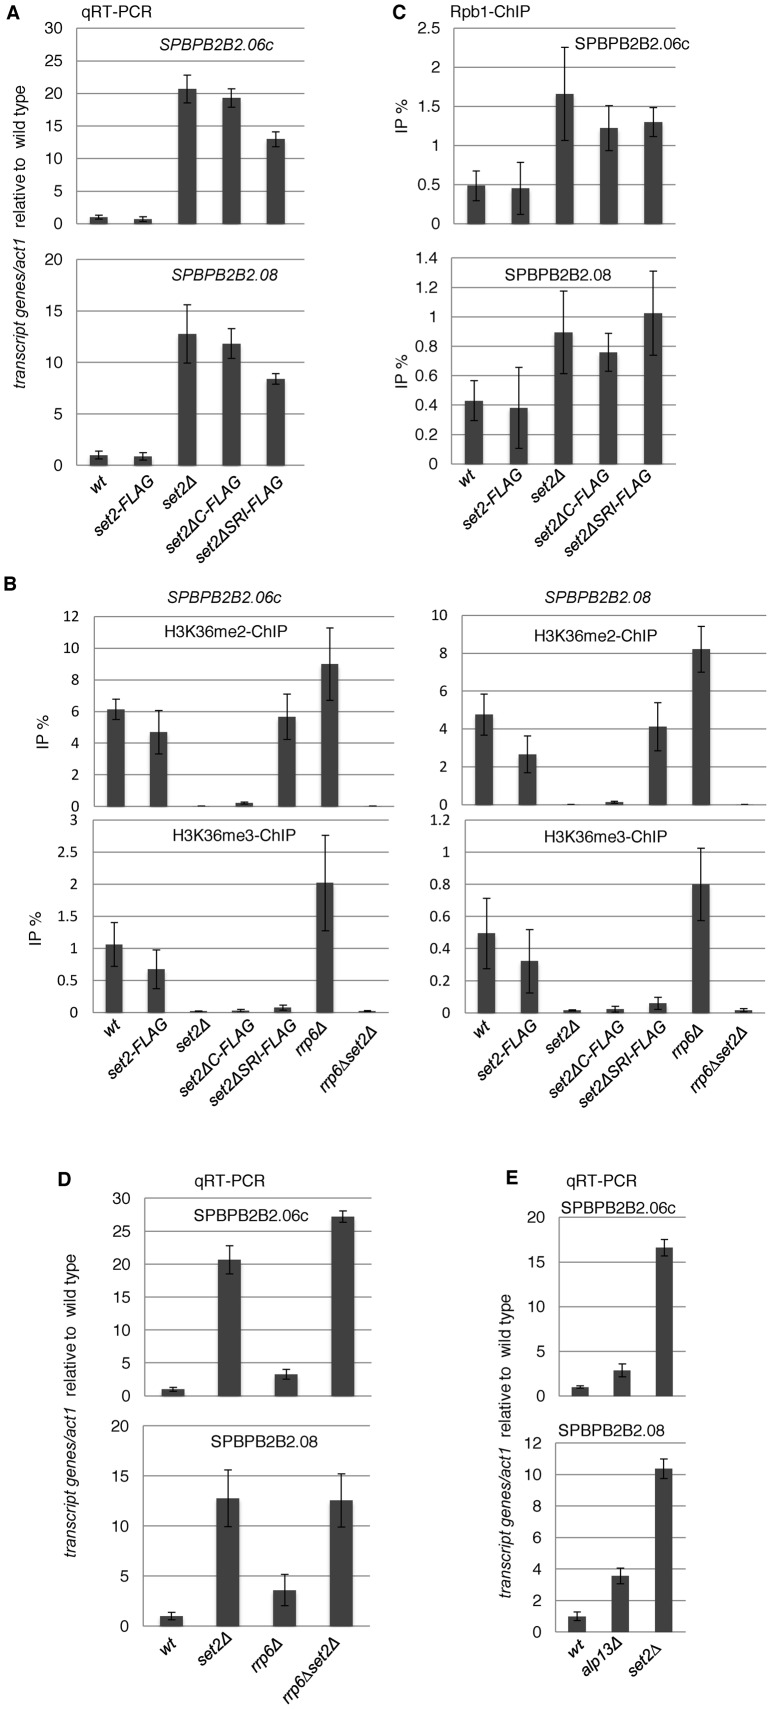
Figure 7.
Set2 downregulates subtelomeric genes, SPBPB2B2.06c and SPBPB2B2.08 at the transcriptional level. (A, D and E) Quantitative RT-PCR (qRT-PCR) analyses of transcripts from both genes in the indicated strains were performed. Error bars show the standard deviation of three independent experiments. (B) Levels of H3K36 methylation at SPBBP2B2.06c and SPBPB2B2.08 in set2 mutants. ChIP analyses of H3K36me2 (upper panels) and H3K36me3 (lower panels) at SPBPB2B2.06c (left panels) and SPBPB2B2.08 (right panels) were performed in the indicated strains. Error bars show the standard deviation of three independent experiments. (C) ChIP analyses of Rpb1 at heterochromatic genes were performed using the indicated strains. Error bars show the standard deviation of three independent experiments.

