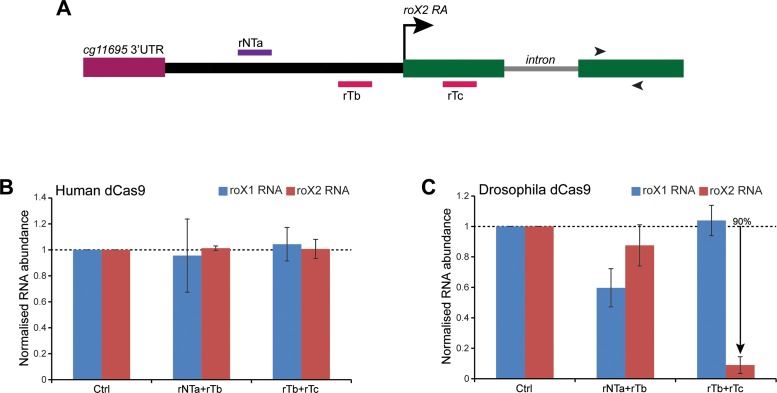
Figure 3.
The roX2 transcript is efficiently down-regulated by CRISPRi. (A) Schematic representation of the Drosophila roX2 locus showing relative positions of the roX2 targeting sgRNAs. The transcription start site is marked by an arrow while the intron within the roX2 gene is shown by a solid grey line. The intergenic region between the roX2 transcription start site and the adjacent gene (cg11695) is shown in solid black line. The sgRNAs targeting the rT and rNT strands are shown in red and violet, respectively. The arrowheads mark the position of the primers used to detect roX2 RNA for RT-qPCR analysis. (B and C) RT-qPCR measurement of abundance of the roX1 and roX2 transcripts in cell lines coexpressing human (B) or Drosophila (C) dCas9 protein and two sgRNAs (as shown on the x-axis). While sgRNAs rTb+rTc do not affect roX1 or roX2 levels in presence of human dCas9, they specifically knockdown roX2 transcript levels in cells coexpressing Drosophila dCas9. The y-axis shows the enrichment of RNAs relative to rp49 transcript and normalized to the cells transfected with pGTL-1 containing a non-targeting sequence (Ctrl). The data are shown from two biological replicates, each performed in triplicate. The error bars indicate SEM. The % shows knockdown in percentage as compared with the Ctrl.

