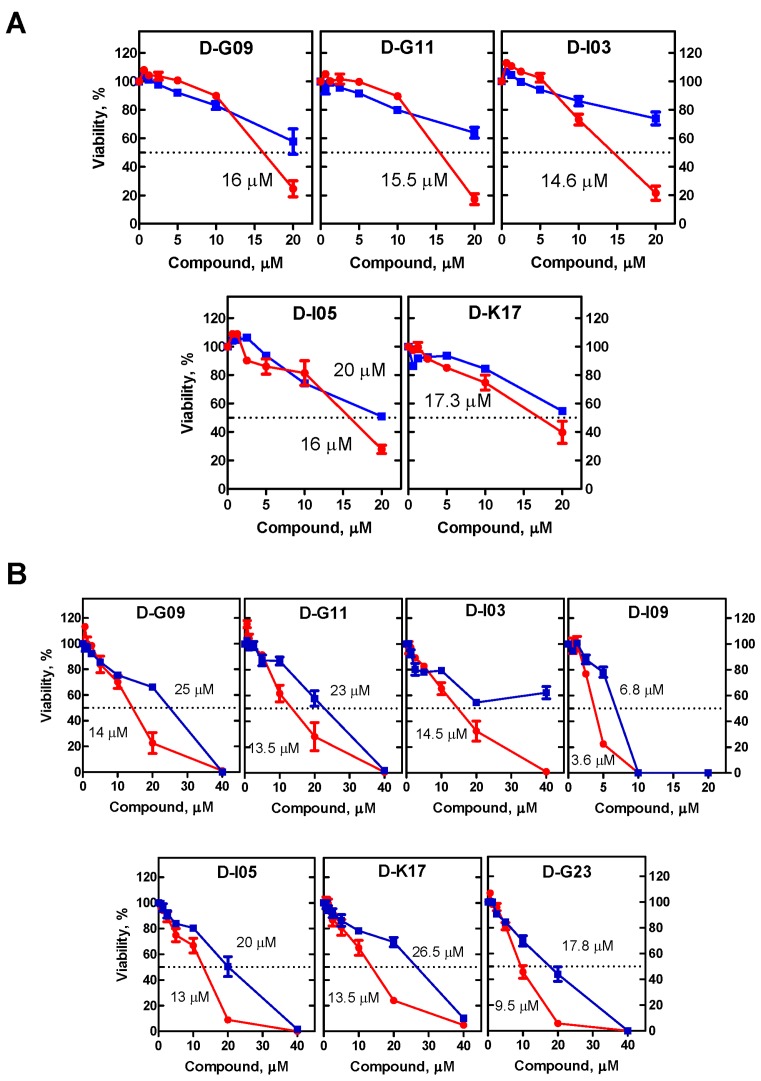
Figure 3.
Effect of the RAD52 inhibitors on survival (A) Capan-1 (BRCA2−) and BxPC3 (BRCA2+) cells and (B) on UWB1.289 (BRCA1−) and [UWB1.289 (+BRCA1)] (BRCA1+) cells. Capan-1 and UWB1.289 are denoted by red line; BxPC3 and UWB1.289 (+BRCA1) indicated by blue line. The experiments were repeated at least three times, error bars indicate SD.

