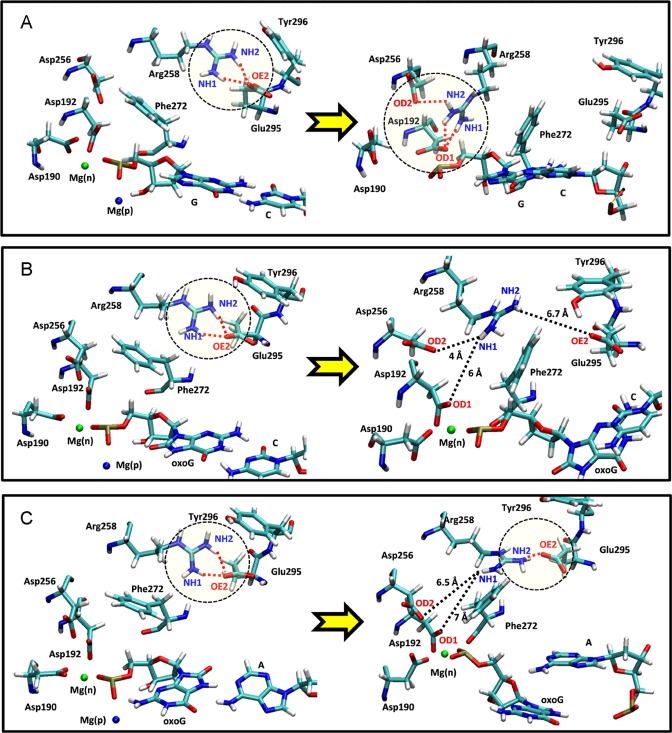
Figure 4.
The configuration of key residues in the active sites of (A) the G:C, (B) oxoG(anti):C and (C) oxoG(syn):A pol-β systems. Structures on the left and right correspond to before opening conformational pathway, and the after Arg258 flip, respectively. The red dashed lines and yellow regions indicate hydrogen bond interactions between atoms. The black dashed lines indicate long distances which do not allow hydrogen bond interactions.

