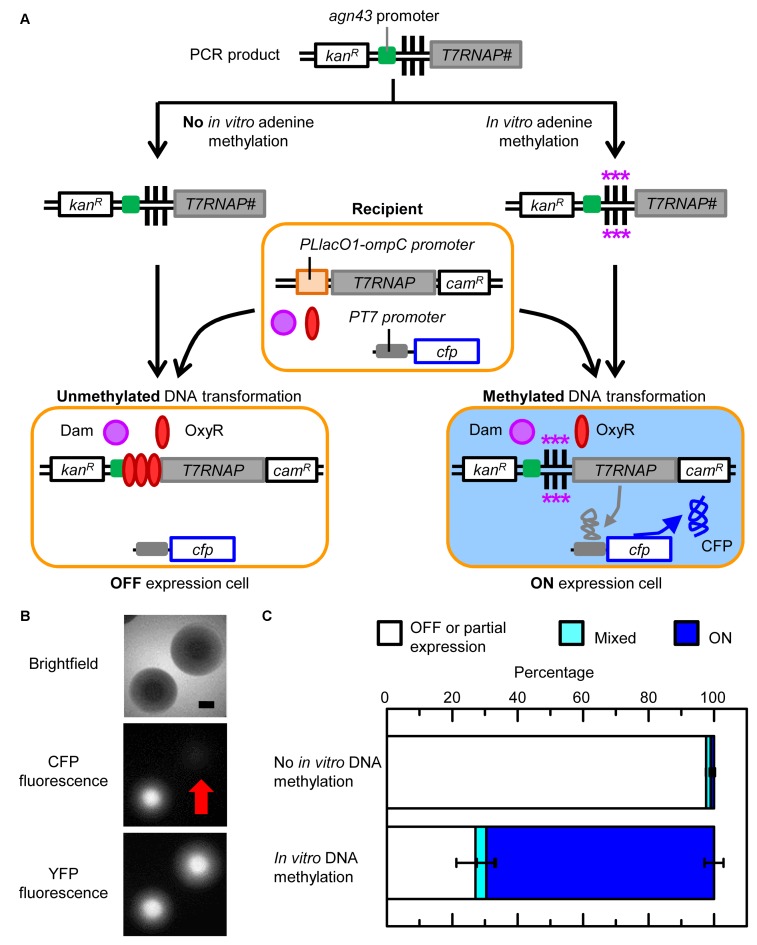
Figure 3.
In vitro DNA methylation and transformation of the agn43 region. Symbols are defined in Figure 1. (A) Schematic of experimental workflow. Asterisks indicate DNA adenine methylation. All genes are chromosomal except the extracellular PCR product before transformation. # indicates the PCR product only contained the first 1014 base pairs (bp) of T7RNAP. The recipient strain is HL6494 (wild-type). (B) Fluorescence and brightfield (with phase condenser annulus 3) microscopy of colonies. Recipient cells contained a chromosomal copy of yfp that was constitutively transcribed (not shown). Scale bar is 500 μm. Red arrow indicates the location of the OFF colony. (C) Percentage of OFF, ON and mixed colonies. Error bars are the SEM of two biological replicates.

